P&E ARM Cortex-M Debugging with FreeRTOS Thread Awareness and Real Time Expressions for GDB and Eclipse

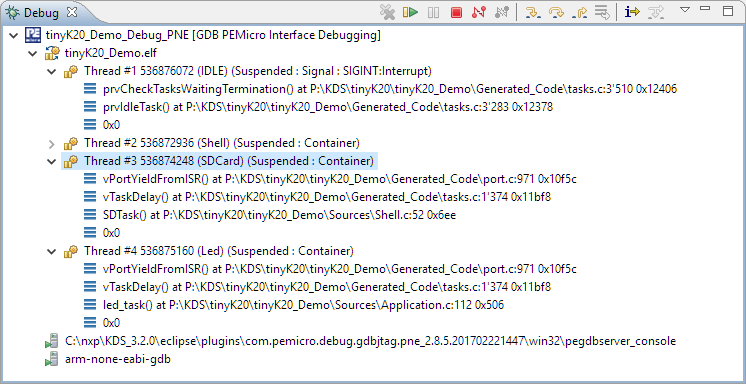
P&E has a new version of their GDB/Eclipse debug plugins available on their Eclipse update site, and it comes with to great features: Real Time Expressions (show variables while target is running) andΒ  FreeRTOS thread awareness πŸ™‚

FreeRTOS Thread Awareness

FreeRTOS Thread Awareness

Continue reading →

Tips for Making Copy of Eclipse CDT Projects Easier

Instead creating a new project from scratch, often it is simpler to copy an existing Eclipse CDT project, then change it and go on.Β  To copy-past the a project in Eclipse:

  1. Select the project in the Project Explorer View (CTRL-C on Windows)

    Copy of a project

    Copy of a project

  2. Then paste it in the Project Explorer View (CTRL-V on Windows), and I can specify the new name:

    Paste of Project

    Paste of Project

However, to make that process simpler, a few things have to be done right in the ‘source’ project first.

Continue reading →

Sous-Vide Cooking: Beef Sirloin Steak

I’m a big fan of ‘low-and-slow’ cooking, and that’s why I love my BBQ Smoker. That smoker is great for Ribs, Brisket or Pulled Pork. But it is not ideal for other pieces of meat. After doing some research, this weekend I tried something differently: “Sous-Vide”. The result is delicious: this is by far the best steak I’ve ever cooked :-).

Beef Sous Vide

Beef Sous Vide

Continue reading →

Remote Board Debugging: J-Link Remote Server with Eclipse

For a CubeSat project we only have a single board available. But multiple universities and developers need to have access to that board for developing and debugging the firmware. We cannot easily ship around the board: that takes a lot of time and during shipment nobody can use the board.

There is a nice feature in the Segger J-Link software which allows to share the debug connection over the network: the J-Link Remote Server. It even works nicely between different networks without complicated firewall setup:

Connected in Tunnel Mode

Connected in Tunnel Mode

Continue reading →

Cycle Counting on ARM Cortex-M with DWT

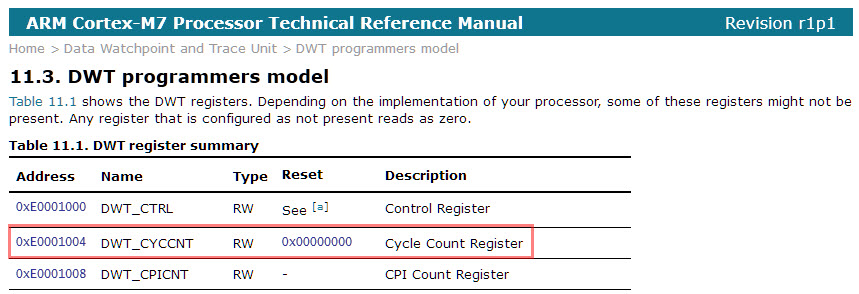
Some ARM Cortex-M have a DWT (Data Watchpoint and Trace) unit implemented, and it has a nice feature in that unit which counts the execution cycles. The DWT is usually implemented on most Cortex-M3, M4 and M7 devices, including e.g. the NXP Kinetis or LPC devices.

Continue reading →

Zephyr: Thoughts and First Steps on the ARM Cortex-M4F with gcc, gdb and Eclipse

The concept of Linux (Open Source, broad developer base and broad usage) is a success story. While there is a lot of diversity (and freedom) in the Linux world, Linux is Linux and again Linux :-). And the world has (mostly) standardized on Linux and its variants on the high embedded system side.

On the other side, the ‘middle and lower end’ Embedded world is fragmented and in many aspects proprietary. So it was no surprise to me when the Linux Foundation announced the ‘Zephyr’ project back in February 2016:

“The Linux Foundation Announces Project to Build Real-Time Operating System for Internet of Things Devices. Open source Zephyrβ„’ Project aims to deliver an RTOS; opens call for developers to help advance project for the smallest footprint IoT devices.“

ΖΡφυρος (Zephyros) is the Greek good of spring and the west wind. Obviously this inspired the logo for the Zephyr project:

Zephyr logo
Zephyr logo (Source: https://www.zephyrproject.org/)
Continue reading →

“No source available”, or how to Debug Multiple Binaries with GDB and Eclipse

When working and debugging a bootloader, debugging can be a challenge: During debugging the bootloader, a new binary gets loaded into the microcontroller address space which is unknown to the debugger. As soon as I step into the newly loaded binary, I only see assembly code, with that ugly “No source available” in Eclipse:

No Source Available, debugging in assembly

No Source Available, debugging in assembly

But wait: GDB is able to do pretty much everything you can imagine, so here is how to debug multiple binaries with GDB and Eclipse, and to turn the above into something which is easy to debug:
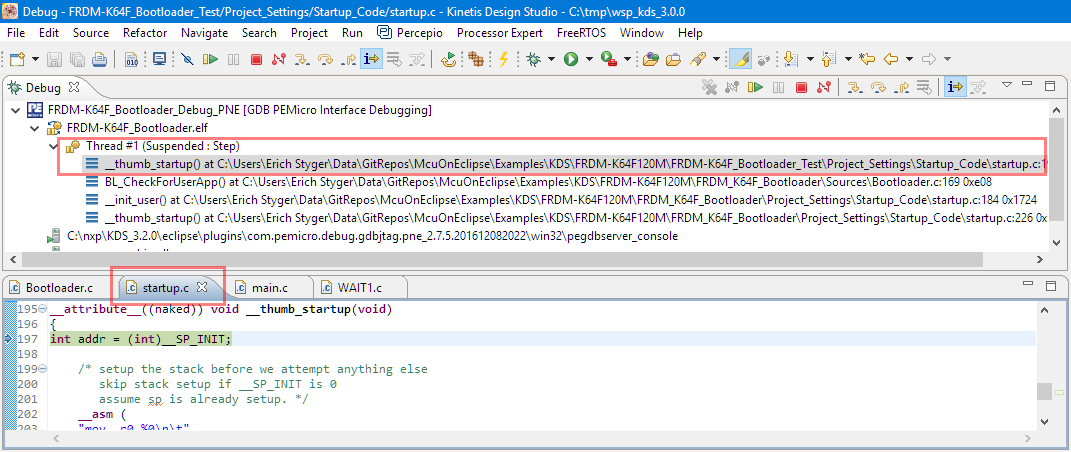
Debugging with Symbolics

Debugging with Symbolics

Continue reading →

Reprogramming the Mikroelektronika Hexiwear Dockingstation

The Hexiwear docking station would have a nice feature: it has embedded a debug circuit (OpenSDA). That way I would not need an external debug probe to debug the Hexiwear. However, a debug probe is required to reprogram the docking station itself:

Repgrogramming the Mikroelektronika Docking Station

Repgrogramming the Mikroelektronika Docking Station

Continue reading →

Debugging ARM Cortex-M0+ HardFaults

To me, one of the most frustrating things working with ARM Cortex-M cores are the hard fault exceptions. I have lost several hours this week debugging and tracking an instance of a hard fault on an ARM Cortex-M0+ device.

Next assembly step will cause a hard fault
Continue reading →

Upgrading to Sharp 128×128 Pixel Memory Display

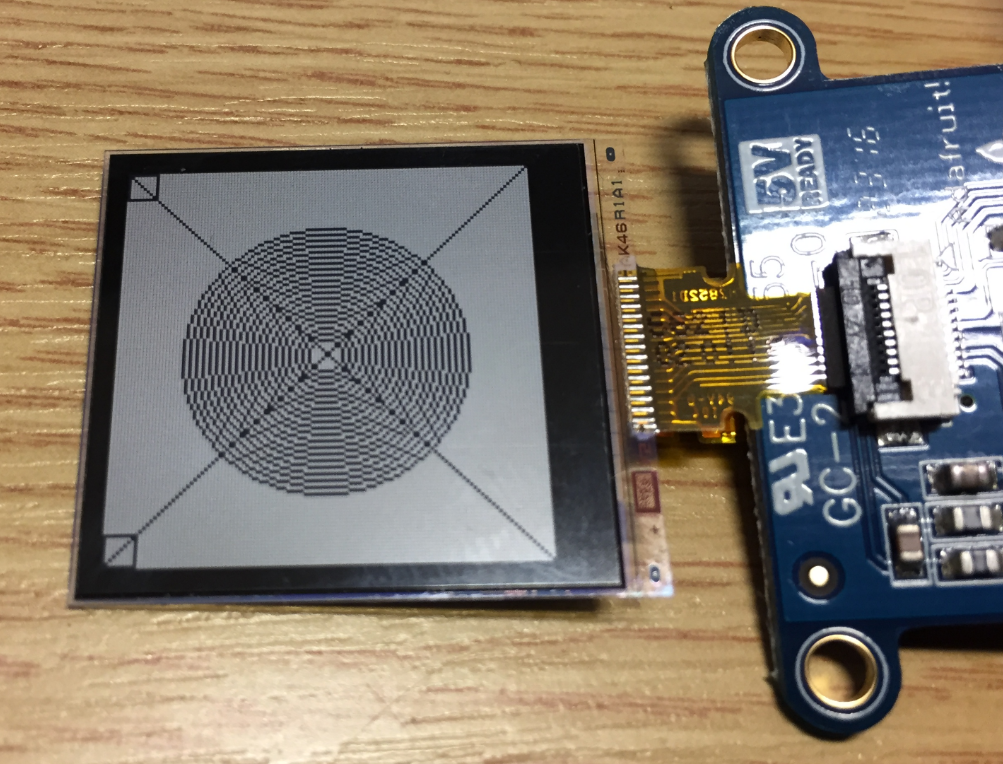
In “Low Power LCD: Adafruit Breakout Board with Sharp Memory Display” I used a 96×96 Sharp Display (LS013B4DN04) with the Adafruit breakout board, but because that one seems to be EOL (End Of Life), I searched for a replacement. I have found the 128×128 pixel version (Sharp LS013B7DH03), and best of all, it is pin compatible :-). With a small tweak of the driver, it works :-):

Sharp Memory Display 128x128

Sharp Memory Display 128×128

Continue reading →