
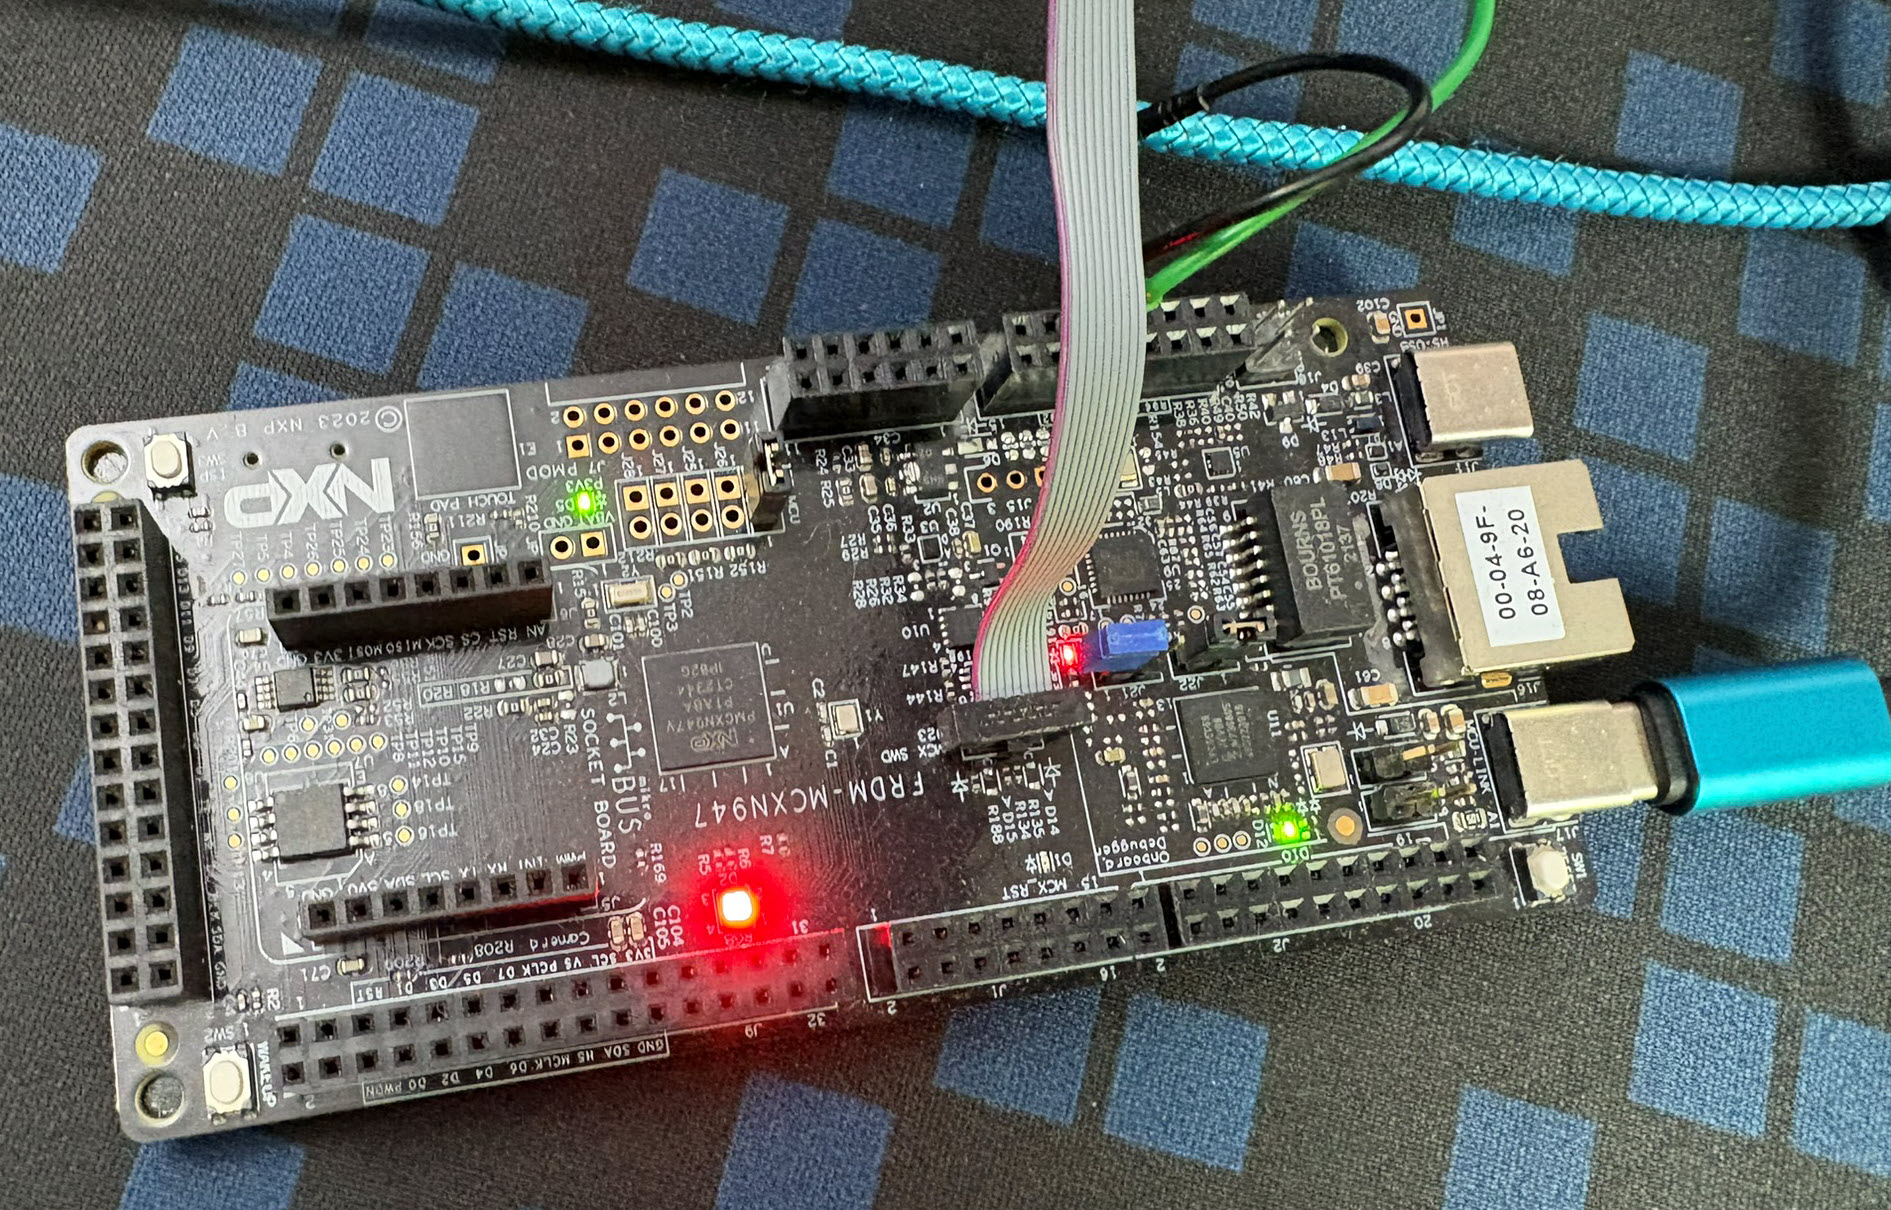
In my latest research project I’m using the NXP FRDM-MCXN947 board. As part of that project I have to collect and export application trace data for later analysis. In that project I’m using the the Tracealyzer product from Percepio.
In this article I describe different ways to export trace data from the embedded target: using generic GDB commands or with an trace exporter in VS Code.
Outline
With Tracealyzer, the application gets instrumented to record system actions. I can stream the data for example using SEGGER RTT. Or I can record data in a ring buffer.
Using a ring buffer has the advantage that I can record data without a debug session. Then I can connect with the debugger and get the latest data in the buffer. Alternatively I can set a breakpoint in the ‘buffer full’ (OnTraceWrap()) callback and store the data at that point.
In this article, I’m using VS Code with NXP LinkServer based debugging on the FRDM-MCXN947 board. It works fine with cortex-debug and mcuxpresso-debug extensions.
Ring Buffer Trace configuration
In my application, I’m using a ring buffer to record the trace data.
For this, I initialize the trace library with
vTraceEnable(TRC_START);
McuLib Configuration
In this project, I’m using the McuLib with the following configuration:
/* FreeRTOS */
#define McuLib_CONFIG_SDK_USE_FREERTOS              (1)
#define configUSE_TRACE_FACILITY                        (1)
#define configGENERATE_RUN_TIME_STATS                   (1)
#define configGENERATE_RUN_TIME_STATS_USE_TICKS         (1)

/* Tracealyzer */
#define configUSE_PERCEPIO_TRACE_HOOKS                  (1) /* Percepio Tracealyzer */
#define McuPercepio_CONFIG_START_TRACE_IN_STARTUP_MODE  TRC_INIT /* TRC_INIT: only initialize trace, start it later with */
#define McuPercepio_CONFIG_RECORDER_MODE                TRC_RECORDER_MODE_SNAPSHOT /*TRC_RECORDER_MODE_STREAMING*/
#if McuPercepio_CONFIG_RECORDER_MODE==TRC_RECORDER_MODE_SNAPSHOT
    /* overwrite defaults in trcSnapshotConfig.h */
    #define TRC_CFG_SNAPSHOT_MODE                      TRC_SNAPSHOT_MODE_RING_BUFFER /* TRC_SNAPSHOT_MODE_STOP_WHEN_FULL */
    #define TRC_CFG_EVENT_BUFFER_SIZE                  (50)
#endif
Writing data with GDB
One way to export the data is using the GDB ‘dump’ command.
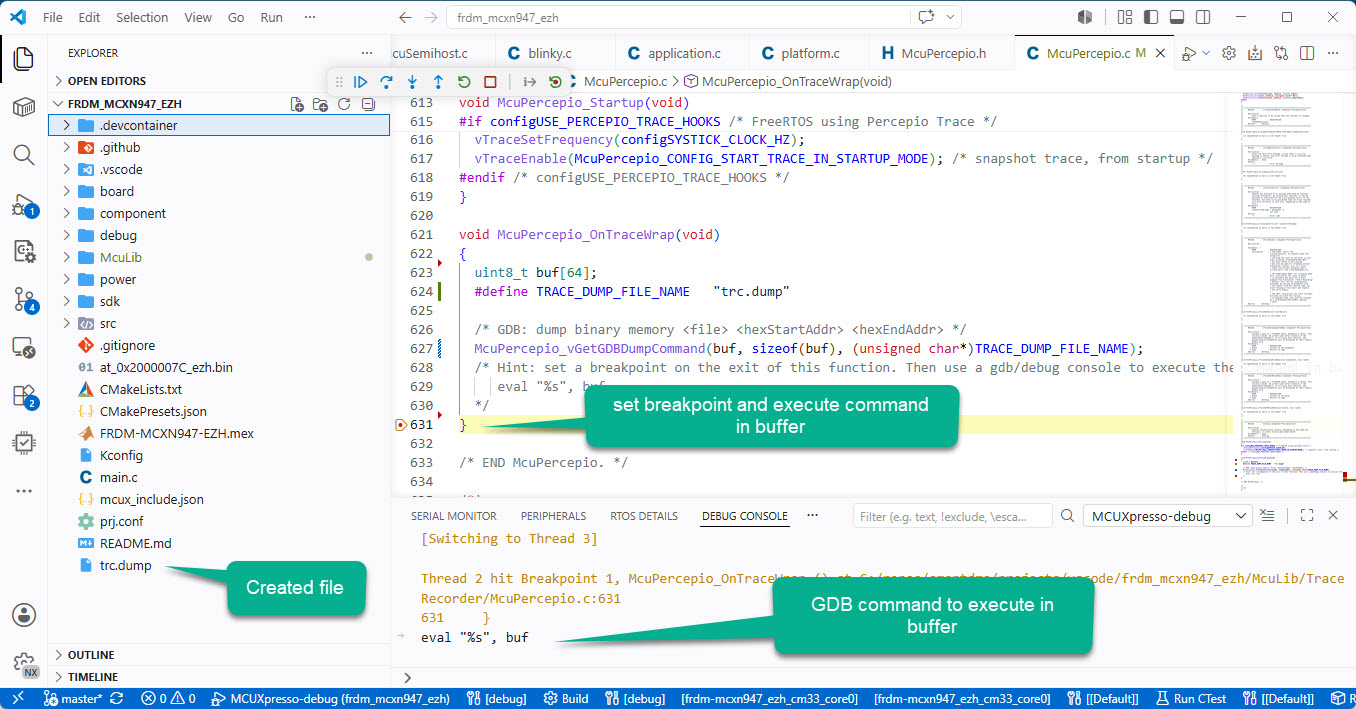
The code below in the callback creates a GDB dump command in the form of
dump binary memory <file> <hexStartAddr> <hexEndAddr>
void McuPercepio_OnTraceWrap(void)
{
  uint8_t buf[64];
  #define TRACE_DUMP_FILE_NAME   "trc.dump"

  /* GDB: dump binary memory <file> <hexStartAddr> <hexEndAddr> */
  McuPercepio_vGetGDBDumpCommand(buf, sizeof(buf), (unsigned char*)TRACE_DUMP_FILE_NAME);
  /* Hint: set a breakpoint on the exit of this function. Then use a gdb/debug console to execute the command in buf:
     eval "%s", buf
  */
}
With this, I can set a breakpoint and use the GDB ‘eval’ command to execute the command in the buffer, exporting the data to a file:
However, there are subtle differences how to execute the command, depending on the VS Code extension used:
- cortex-debug:
eval \"%s\",buf - mcuxpresso-debug:
eval "%s",buf
TraceExporter for VS Code
Percepio makes a VS Code extension available here: https://percepio.com/traceexporter-for-vs-code/. I’m using the version 0.3.1 at the time of this article.
You need to install the extension as .vsix file.
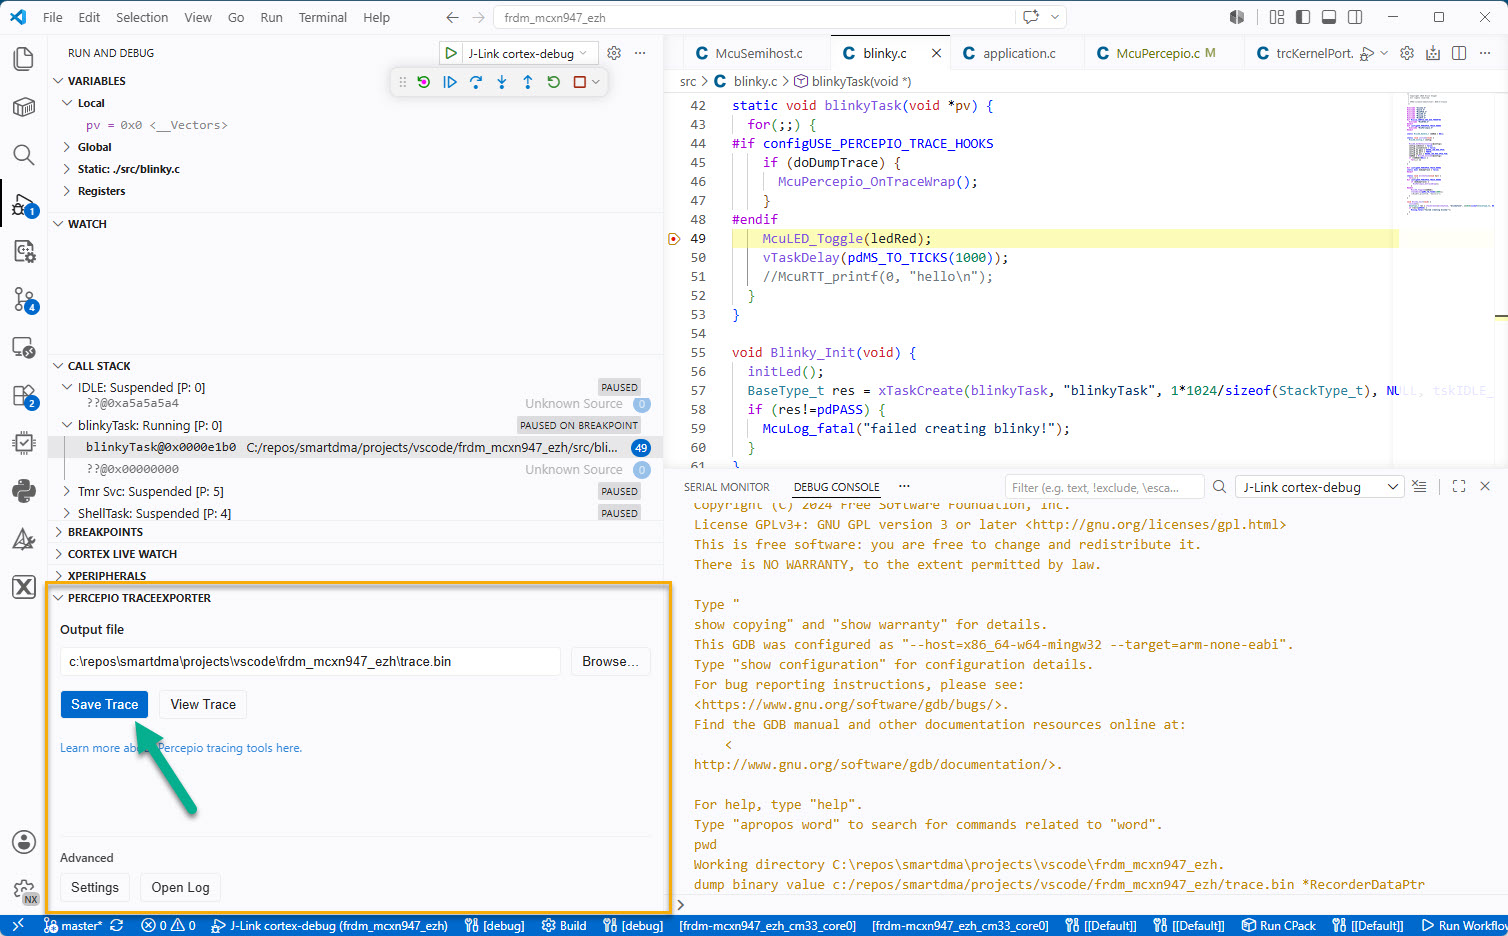
With the extension, I can halt the target anywhere and then press the ‘Save Trace’ button:
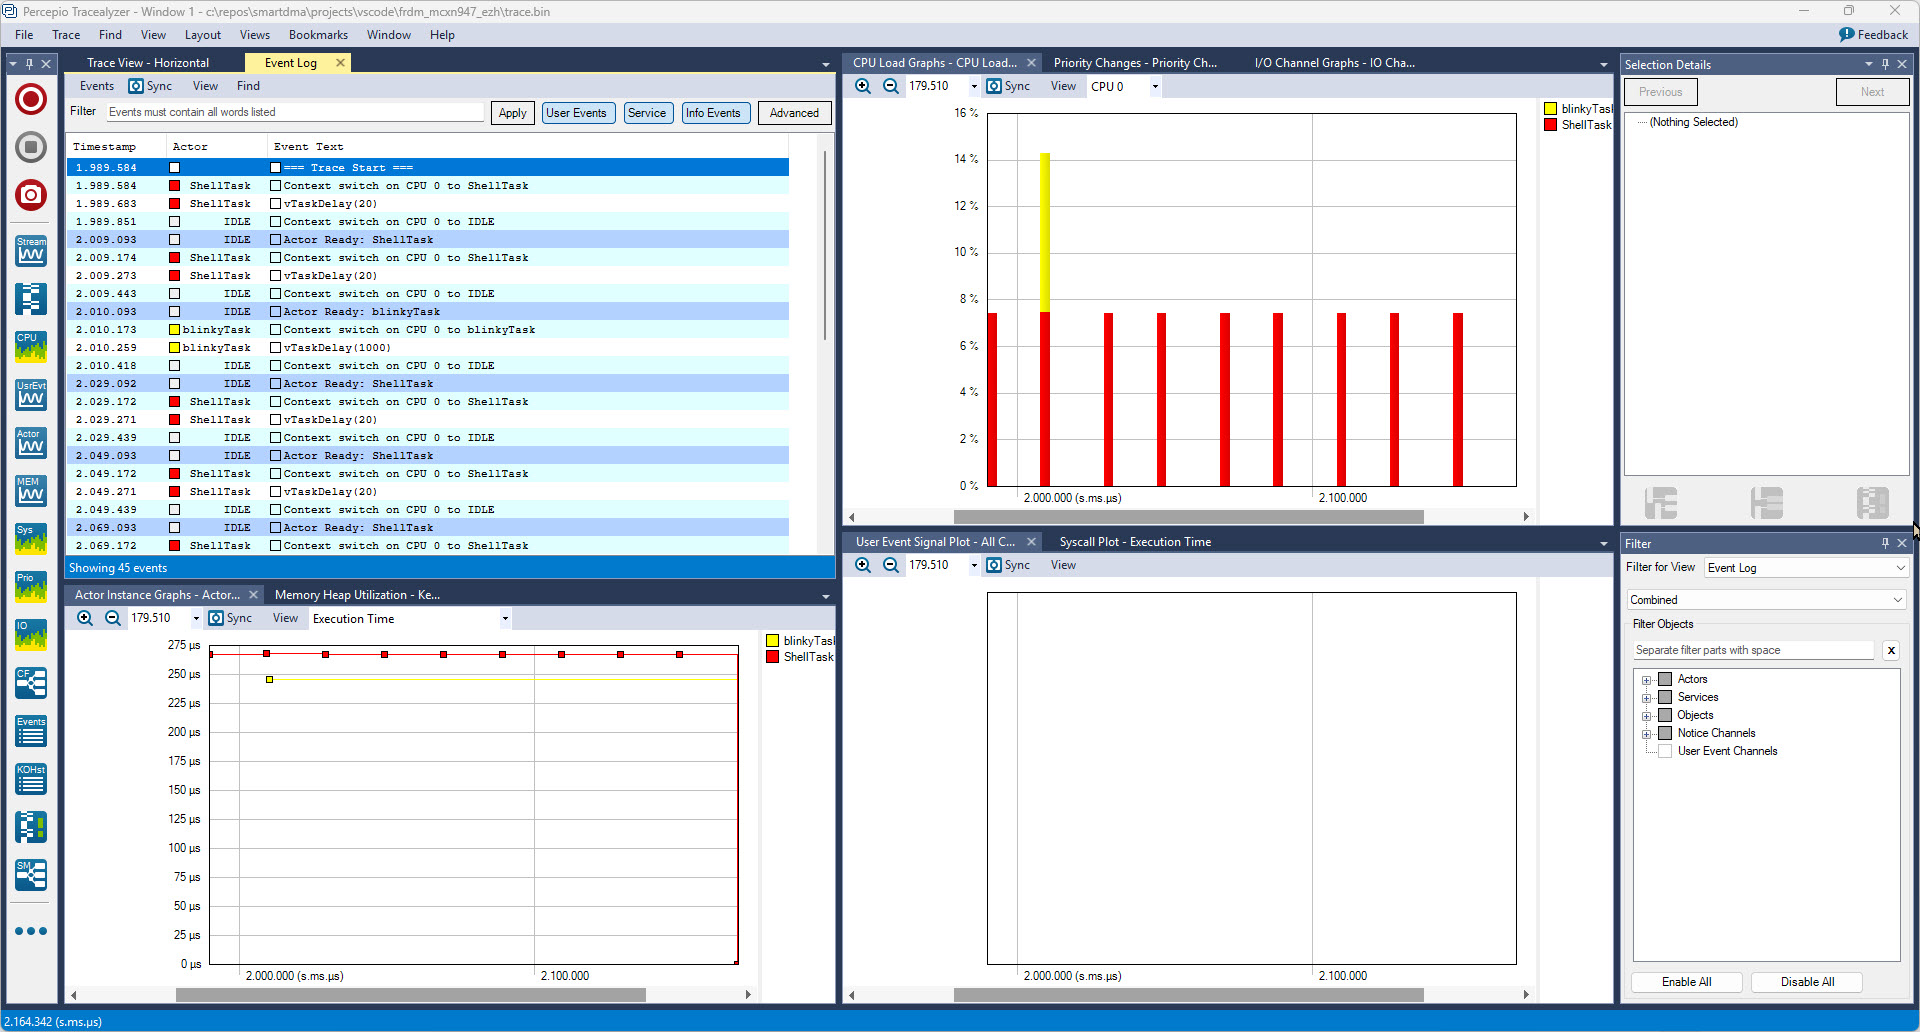
The additional benefit of the extension is that I can press a button to view the trace data:
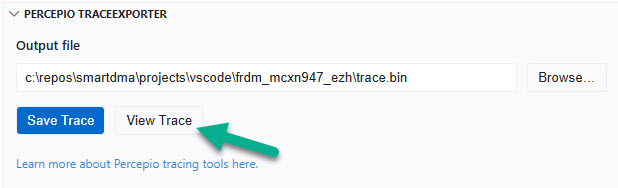
Make sure that the Percepio Tracealyzer executable is present in the PATH. This opens the Percepio Tracealyzer application with the exported data:
Summary
Traditionally, I have used generic GDB commands to export trace data. This works with command-line gdb or even with GDB in VS Code code. But if using VS Code, the Percepio Tracealyzer extension comes handy. With a button click I can export the data and with another button I can analyze the data. Which makes everything very easy.
Beside of using the proposed exporting methods: another one would be using semihosting, see https://mcuoneclipse.com/2026/06/01/semihosting-with-linkserver-in-vs-code/.
Happy tracing 🙂
Links
- Percepio Tracealyzer: https://percepio.com/tracealyzer/
- NXP VS Code Extension: https://www.nxp.com/design/design-center/software/development-software/mcuxpresso-software-and-tools-/mcuxpresso-for-visual-studio-code:MCUXPRESSO-VSC
- TraceExporter for VS Code: https://percepio.com/traceexporter-for-vs-code/
- FRDM-MCXN947: https://www.nxp.com/design/design-center/development-boards-and-designs/FRDM-MCXN947
- McuLib: https://github.com/ErichStyger/McuLib

Hi Erich
I have used tracealyzer to capture problematic behavior and write them down to a microSD card (with FatDFSwhen they are detected. This means that i can get tracealyzer logs from deployed systems from anywhere.
I have setup a cyclic buffer for Tracealyzer and whenever i detect something that i am interested in, i just write the buffer to a file.
I got the inspiration from this post:
https://forums.freertos.org/t/need-to-increase-the-duration-of-trace-data-using-ccs-percepio-using-snapshotmode/23848/4
And my code is very simpe:
…
FIL trace_file;
FRESULT fr = f_open(&trace_file, trace_filname, FA_WRITE | FA_CREATE_ALWAYS);
if (fr == FR_OK) {
UINT written_bytes = 0u;
void* ptr = NULL;
uint32_t buffer_size = 0u;
(void)xTraceGetEventBuffer(&ptr, &buffer_size);
fr = f_write(&trace_file, ptr, buffer_size, &written_bytes);
…
Best regards
Martin
LikeLike
Hi Martin,
yes, I do the same on some projects too if they have already a file system present.
But many small embedded systems have not enough resources (RAM, FLASH) for this. I see that you are using the standard library calls (f_open(), etc): they are costly again. If I can, I’m using directly the file system API (e.g. ElmChan FatFS or tinyFS) as they are faster and more efficient. But of course this all depends on what headroom you have available. The other strategy I use frequently is steaming off the data directly from the target to the host, e.g. with RTT.
Erich
LikeLike
Hi Erich
Yes, I use FatFS for this aswell. f_open and f_write are available in FatFS.
I have by the way been meaning to dig into the inner workings of FatFS due to something I found by using Tracealyzer. I found it calling malloc / free alot.
I have yet to try out RTT.
Best regards
Martin
LikeLike