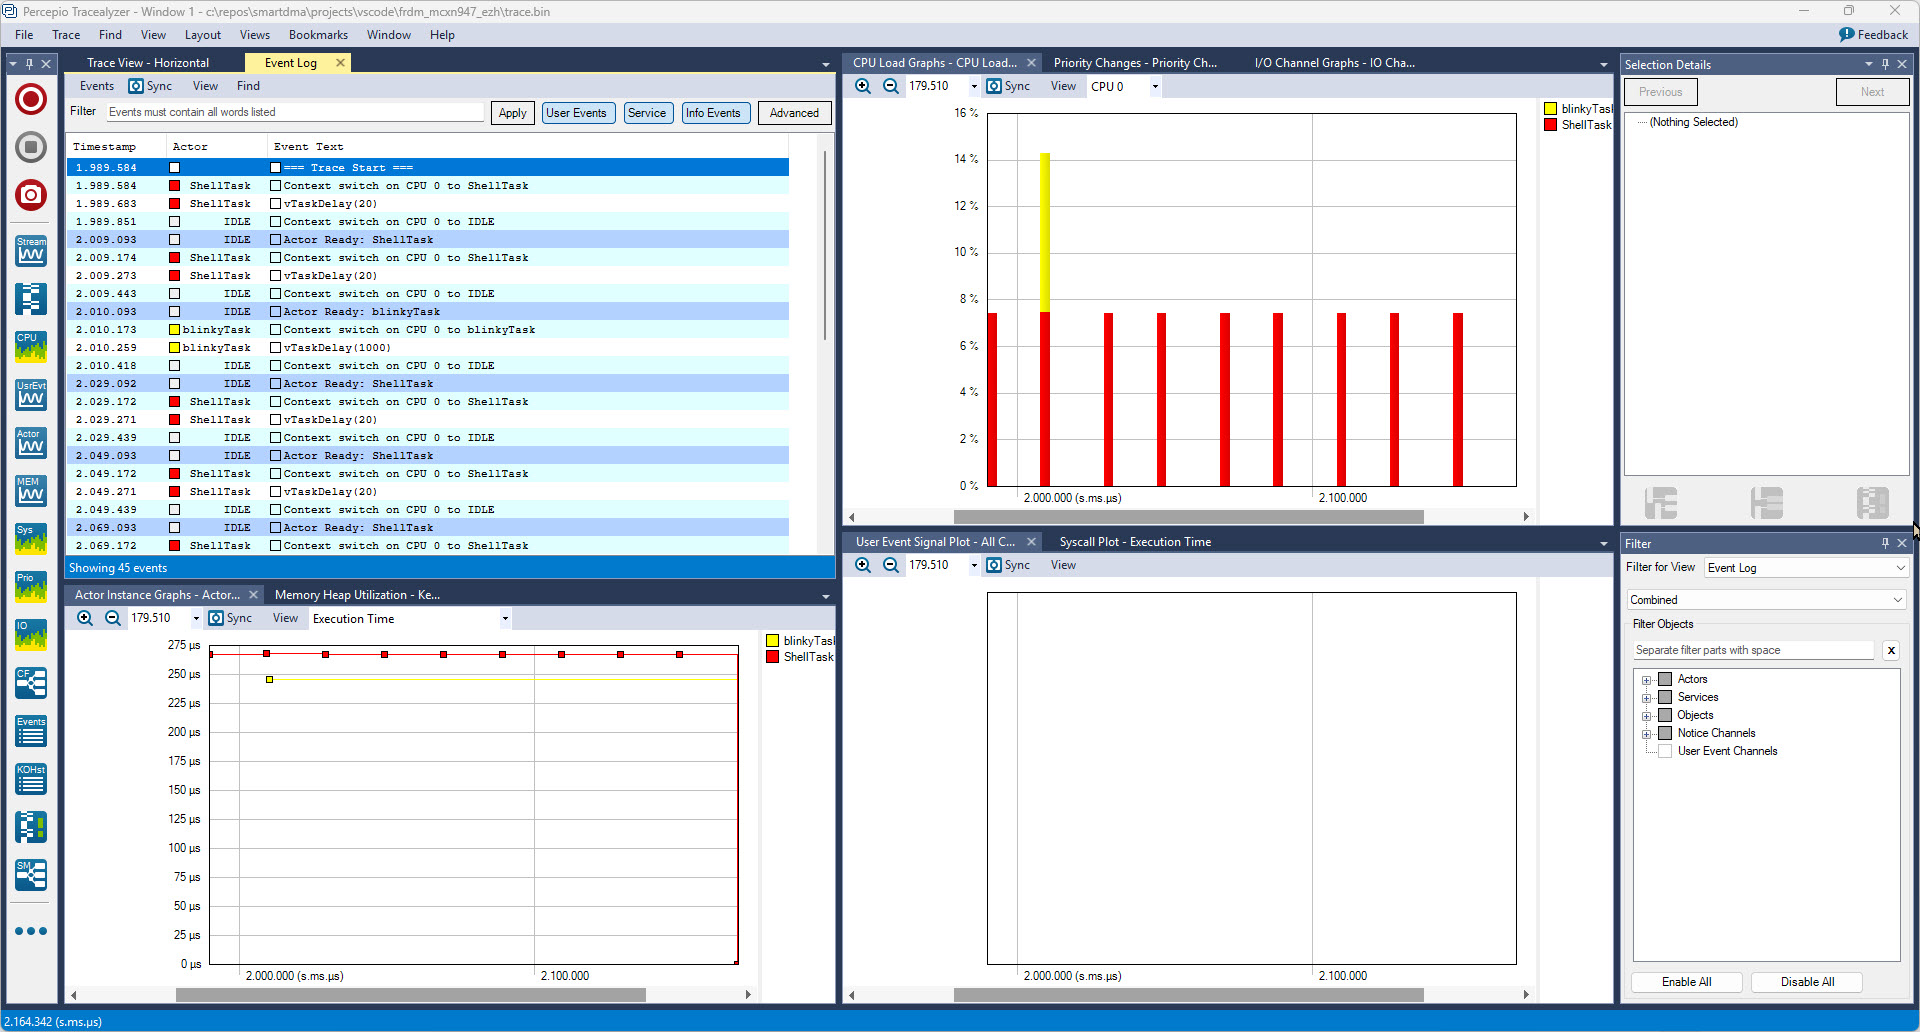
In my latest research project I’m using the NXP FRDM-MCXN947 board. As part of that project I have to collect and export application trace data for later analysis. In that project I’m using the the Tracealyzer product from Percepio.
Trace Data in Percepio Tracealyzer
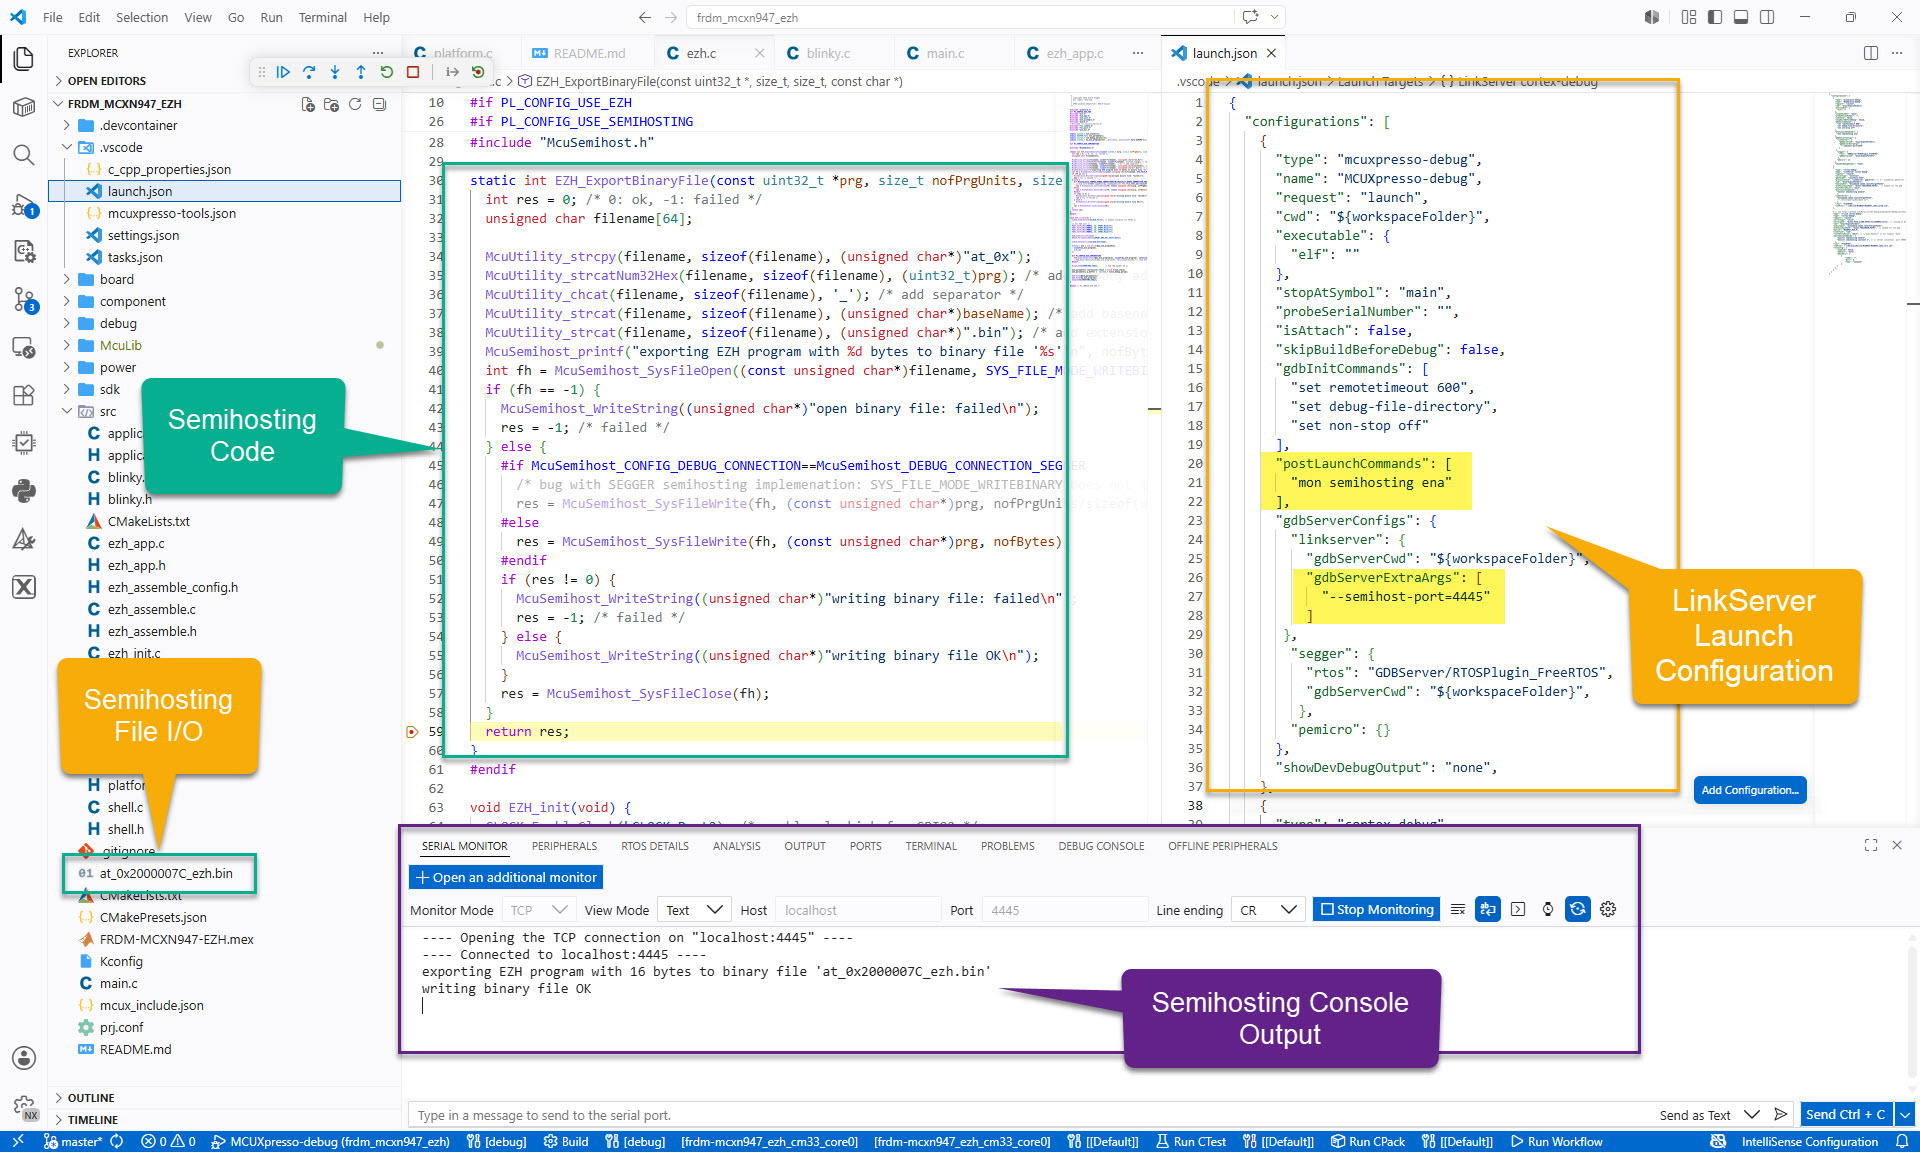
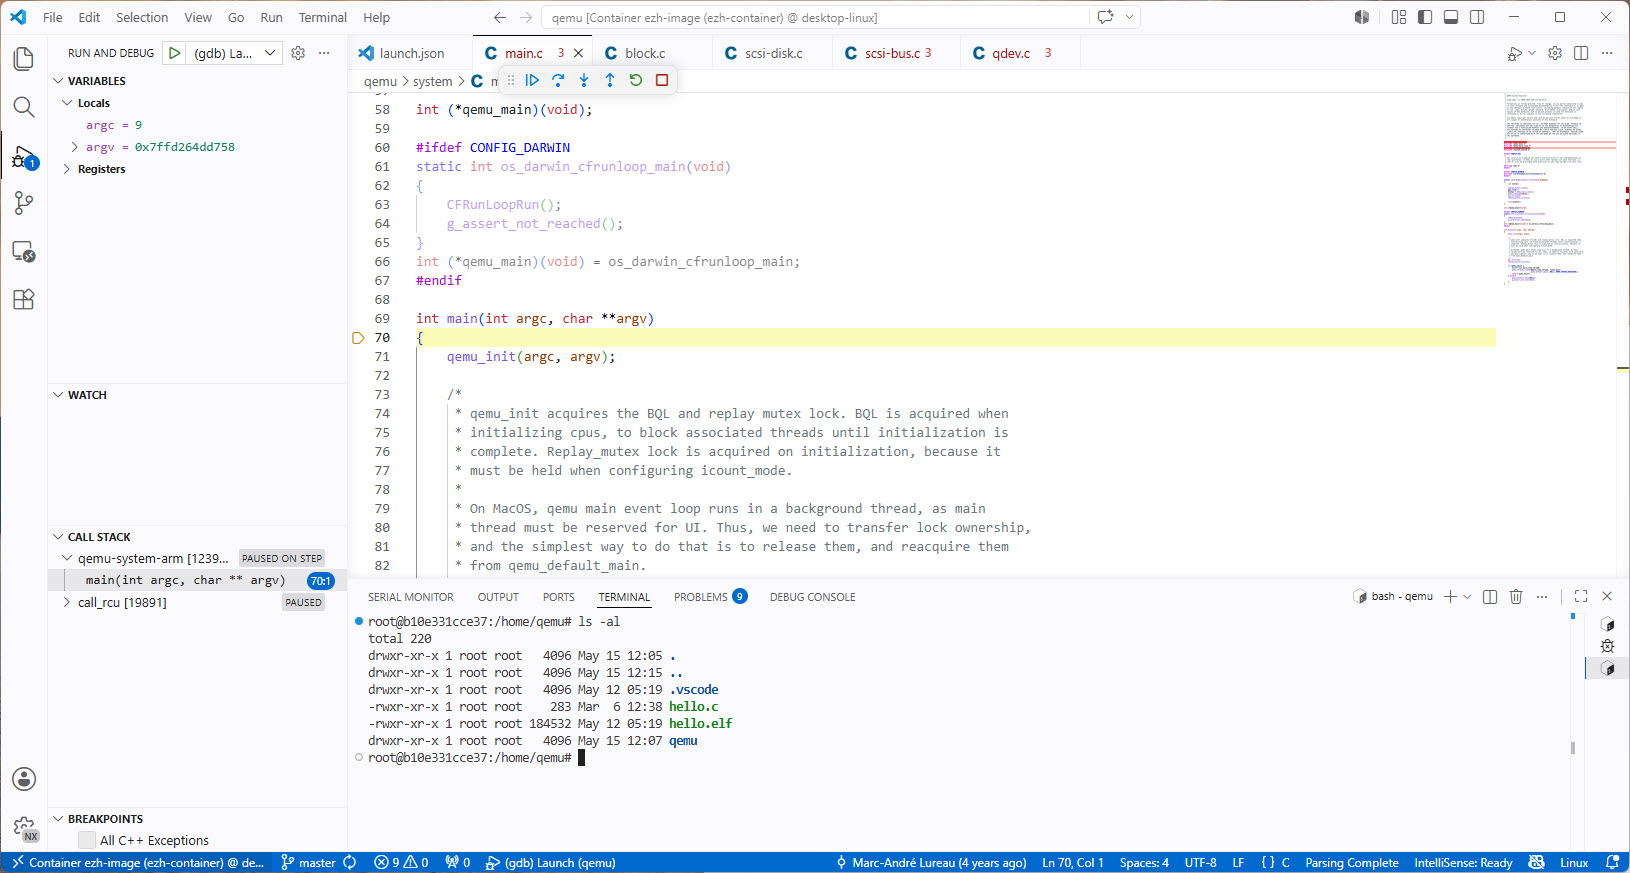
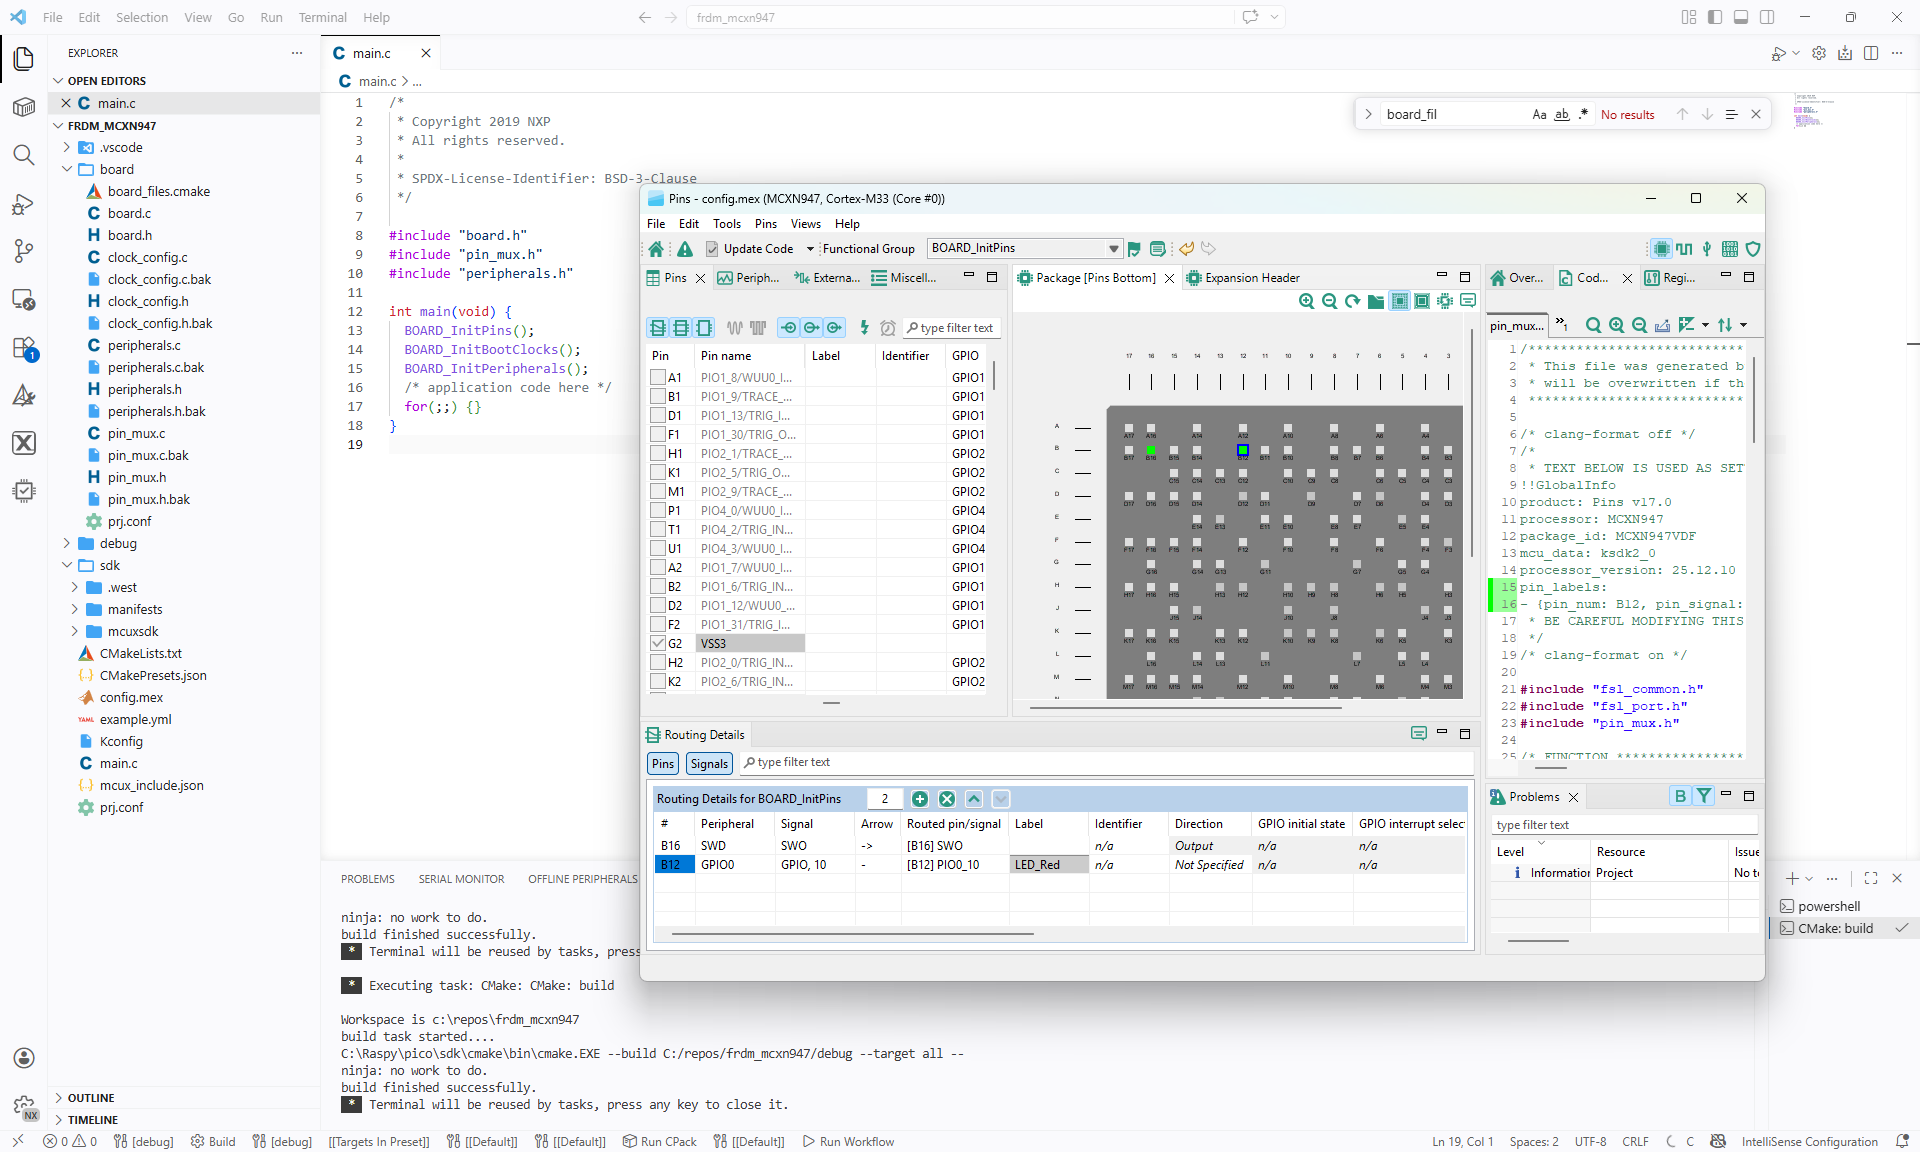
In this article I describe different ways to export trace data from the embedded target: using generic GDB commands or with an trace exporter in VS Code.
For an university research project, I need to write some console output and the same time write a file with data from the embedded board to the host. A logical choice for this is using semihosting.
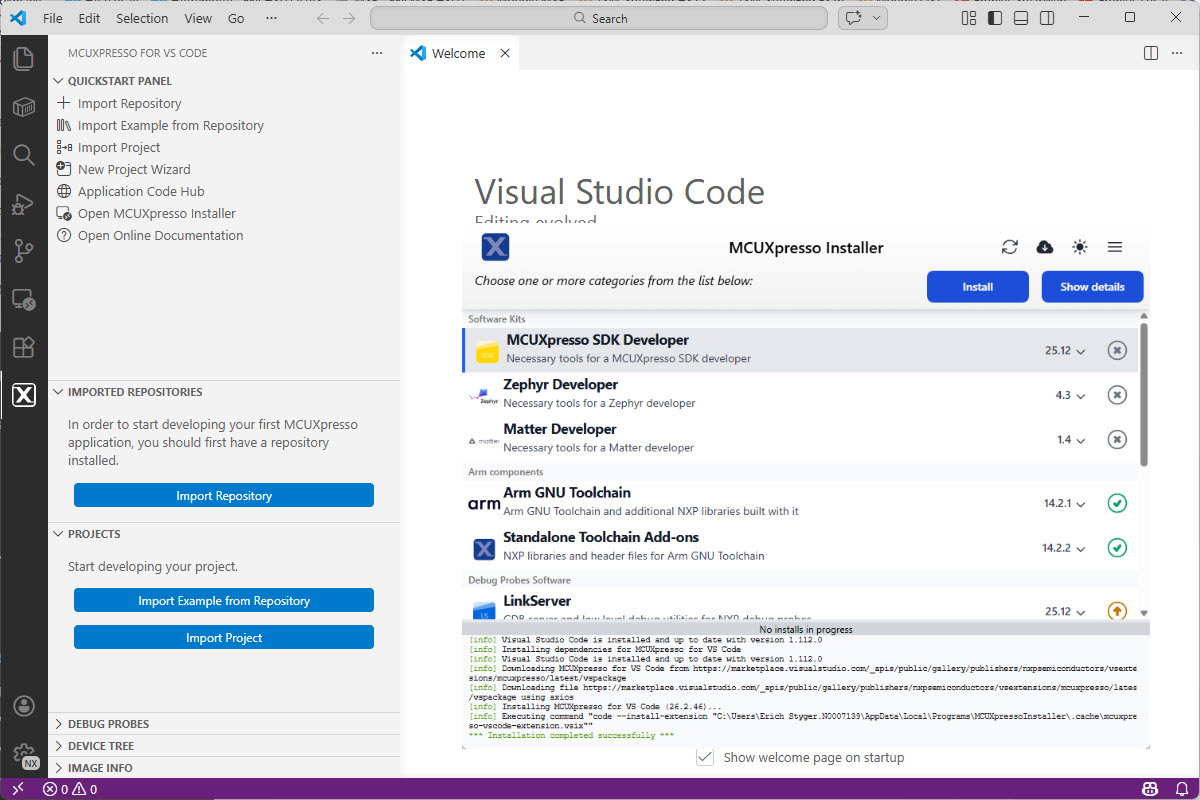
Luckily, although more and different tools are needed these days, the installation experience has improved significantly. It has shifted from installing multiple different tools to a streamlined installation process.
The latest release of the NXP LinkServer supports ARM 64bit (Debian) besides Windows, Linux and MacOS. With this, I can now develop on an NXP i.MX board. Plus, this enables an inexpensive way for automated on-target tests and CI/CD.
A few days ago, a reader of my blog sent me a message:
“Hi Erich, I am reading you since a lot of years. I think you are a pillar of my professional career. Thanks for this. Let me ask you now: what do you think about LLM and coding with LLM in embedded? My employer thinks it time to stop to hire people, because in 1/2 years everything will be substituted by AI. I am not on the same page. Are you using LLM for coding? What do you think about it? Thanks in advance.”
TL;DR: LLMs are changing and improving, making good engineering and education even more important. Studies show that AI can be useful, but productivity will not always increase. AI coding means more critical thinking and responsibility, not less. Engineering and education needs to adopt and change. This includes assessments and didactic, back to paper and defending the work. Learning how to learn is getting the critical skill in the age of AI.
Today’s projects and systems get more and more complex. Many systems include multiple MCUs, connected with a field bus or network, for example CAN. For example there can be up to 70 CAN nodes in modern cars. Such larger and connected systems are a challenge for debugging.
Traditional hardware debugging requires a hardware debug probe, connected with a dedicated SWD/JTAG debug cable to the target device. This needs dedicated pins on the target device plus physical access to the device itself. In many cases, this is not possible in the final product. The hardware debug probes, cables, pins and high speed signals are costly. And worse they can introduce new problems and are prone to interference.
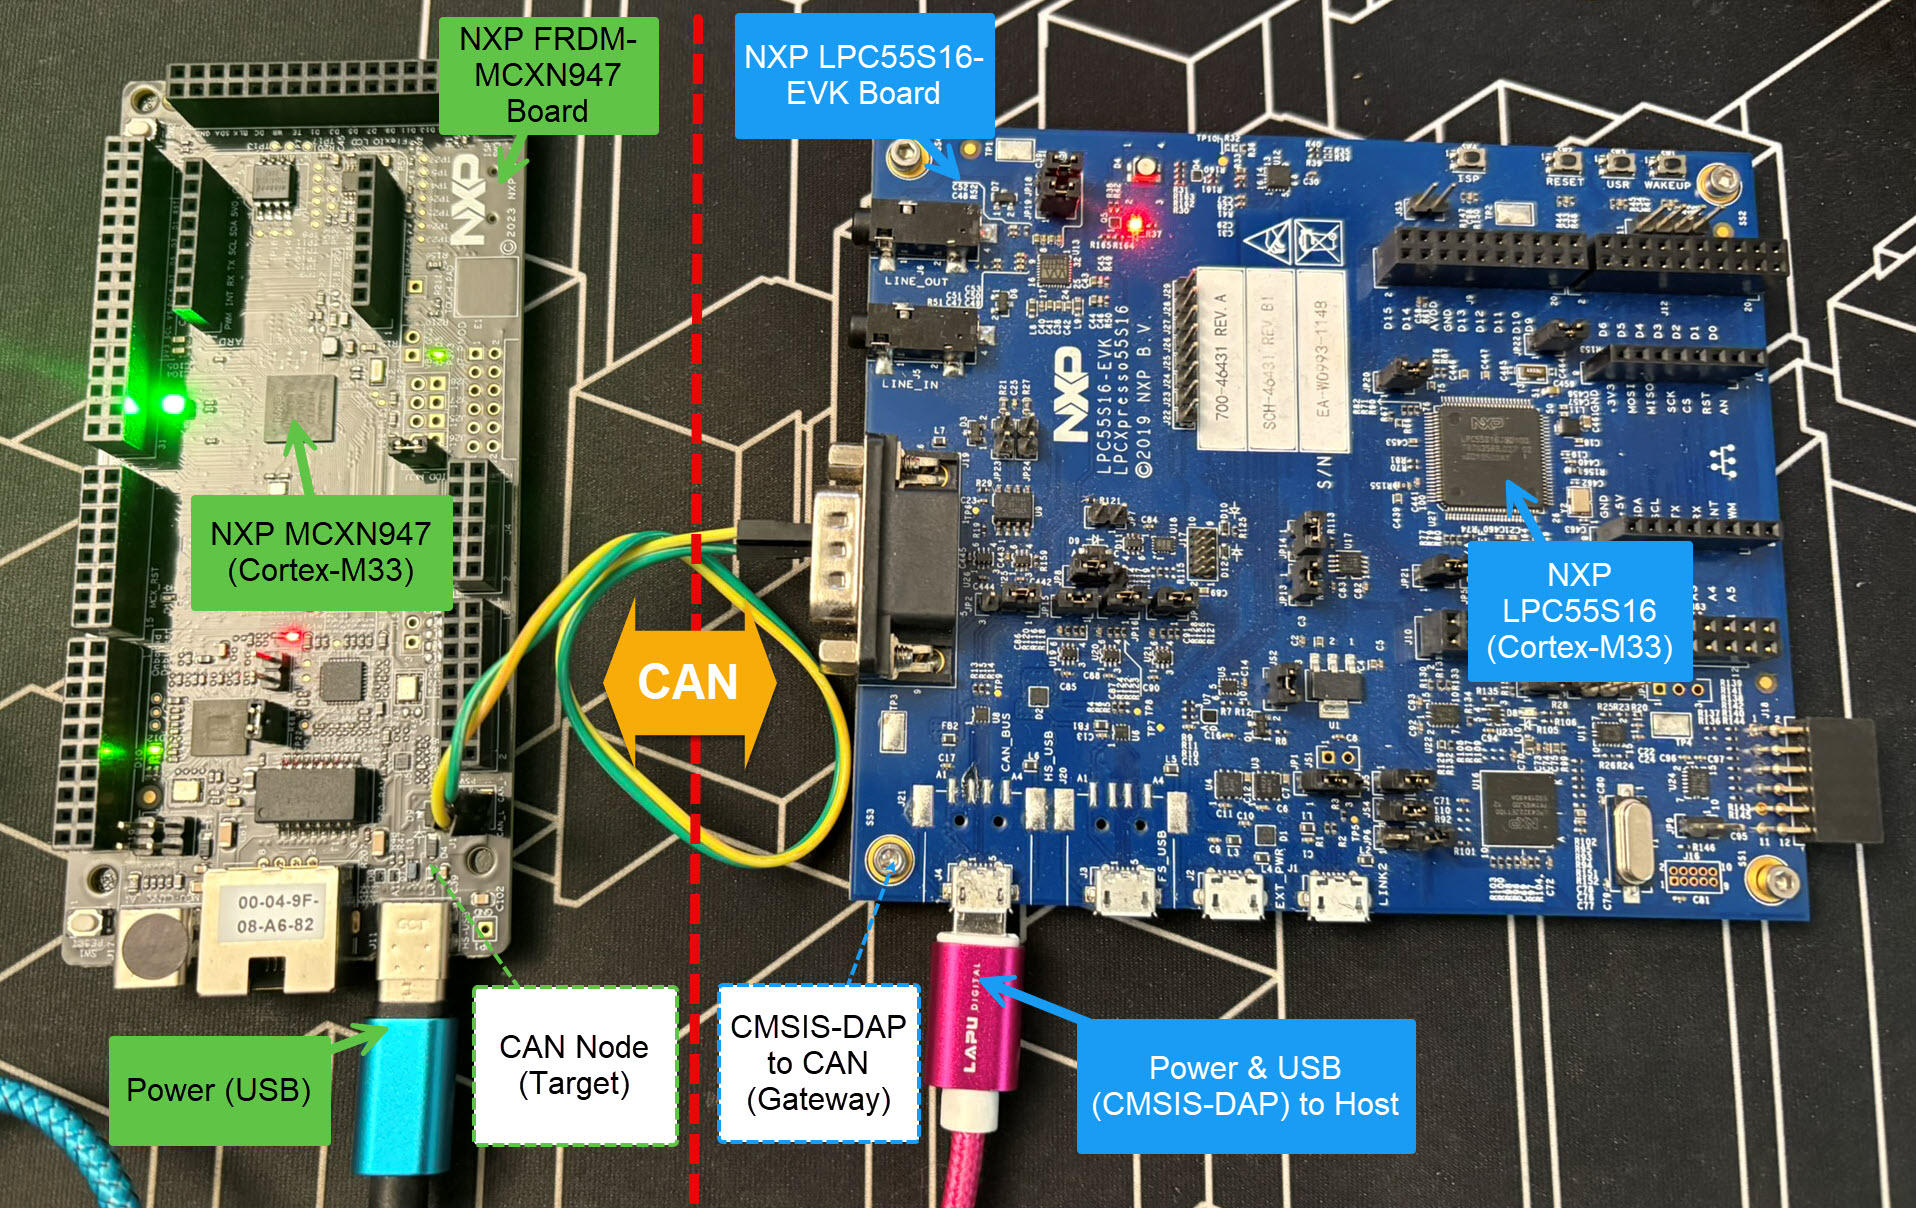
If there is a field bus like CAN connecting all the MCUs, why not use it for hardware debugging? Hardware debugging meaning programming the FLASH memory, halt the MCU, inspect the memory and registers, and step through the code?
Cortex-M Hardware Debugging over CAN
Yes, we can! With the help of a rather unknown hardware feature on ARM Cortex-M devices. We can use the ARM DebugMonitor Interrupt to control and debug the target system. As we would use a JTAG/SWD connection. Instead, we use the CAN bus :-).