Setting up the correct tools for a development environment can be complex and time consuming. I’m using DevContainers with Docker for almost all of my projects. Because that way I get an isolated development environment. For this I spend time to craft dedicated docker files, to have everything installed correctly with the the right versions.
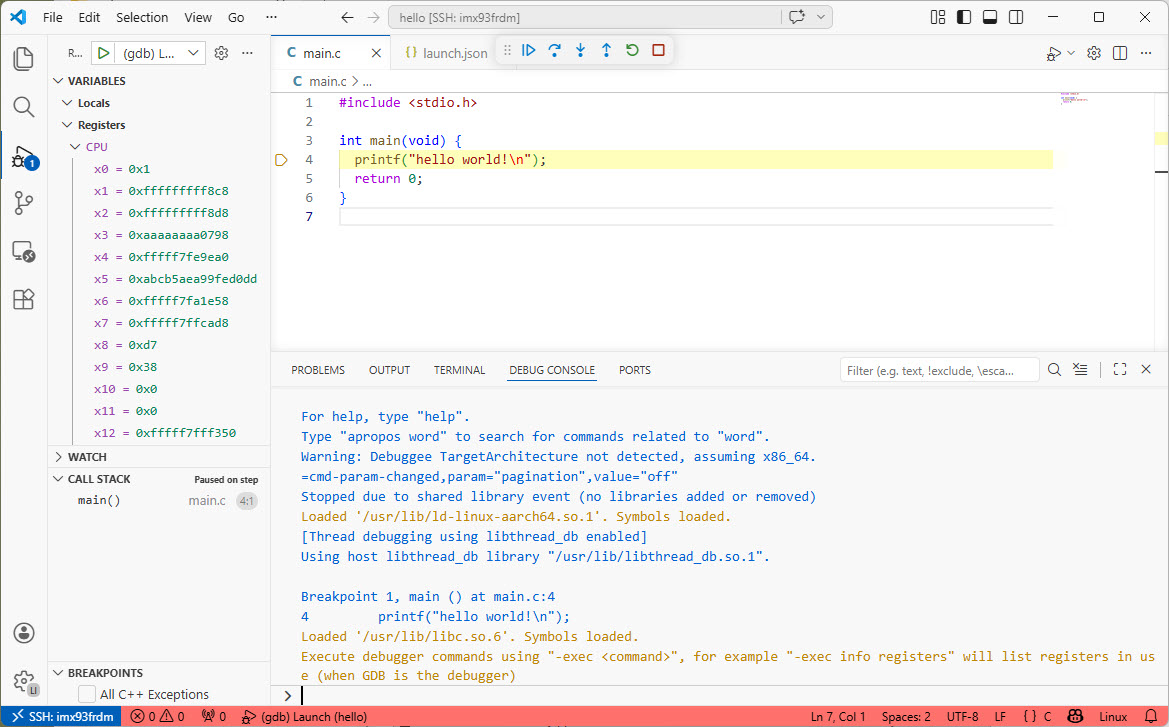
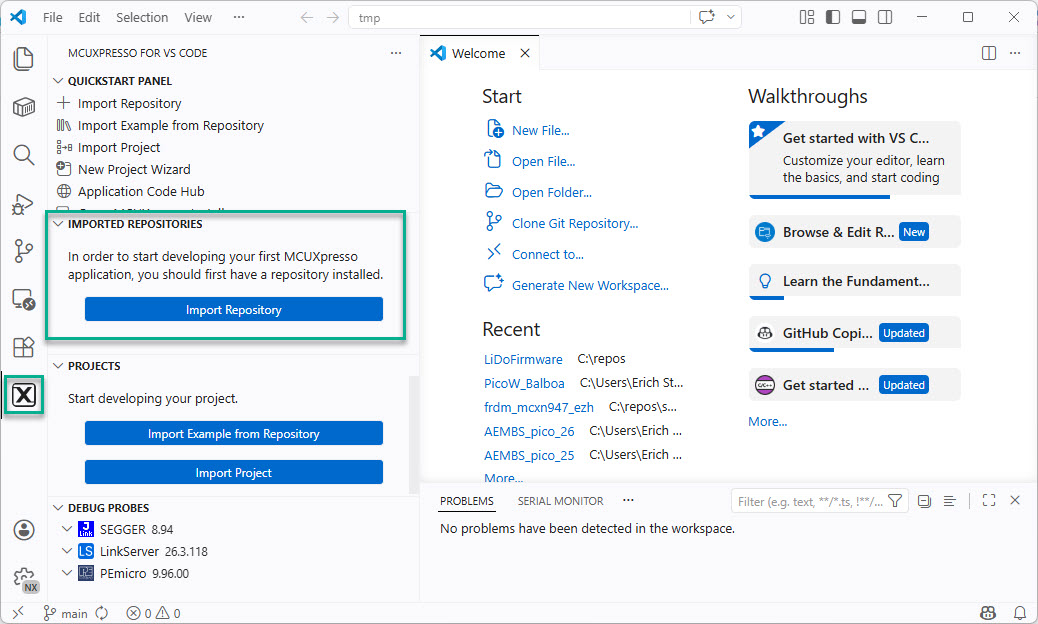
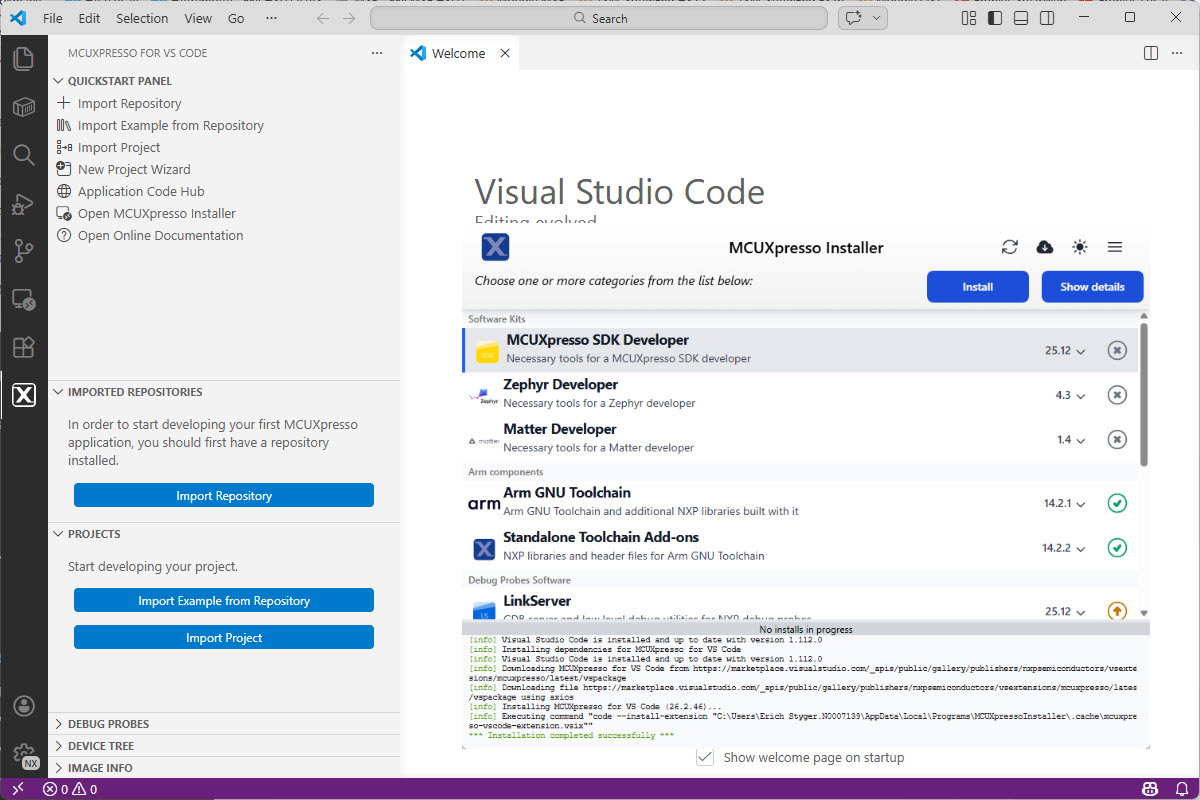
Outside a docker or DevContainer environment, I’m using the NXP MCUXpresso installer. It is a standalone application which can be used from VS Code to check and install all the necessary tools.

In this article, I show how to have the NXP MCUXpresso Installer installed in a DevContainer so it can be used with VS Code.
Continue reading