Git Submodules allow me to keep a git repository as a sub-directory in another git repository. This let me clone another repository into my project and keep sources in and libraries/SDKs in sync.
This can be a challenge if using CI/CD runners. They have to clone the repositories in a recursive way. It gets more complex if the sub-modules are not public. Because the CI/CD runner does not have access rights to the non-public repositories.
GitLab CI/CD Pipeline with successful private submodule usage
In this article I explain how I’m using git sub-modules in my CI/CD GitLab pipeline, both for public and private repositories
The Rust programming language is making its way into different areas: Rust gets added to the Linux Kernel. I see an increasing interest for using Rust in embedded projects. And Rust is used for embedded tools. I noticed this with the latest LinkServer v25.09 release: there is a new tool included in the package, rblhost.
rblhost on crates.io
The release note just mentioned:
- Switched to using rapid blhost (rblhost) utility.
This triggered my interest, and actually that utility is implemented in Rust :-).
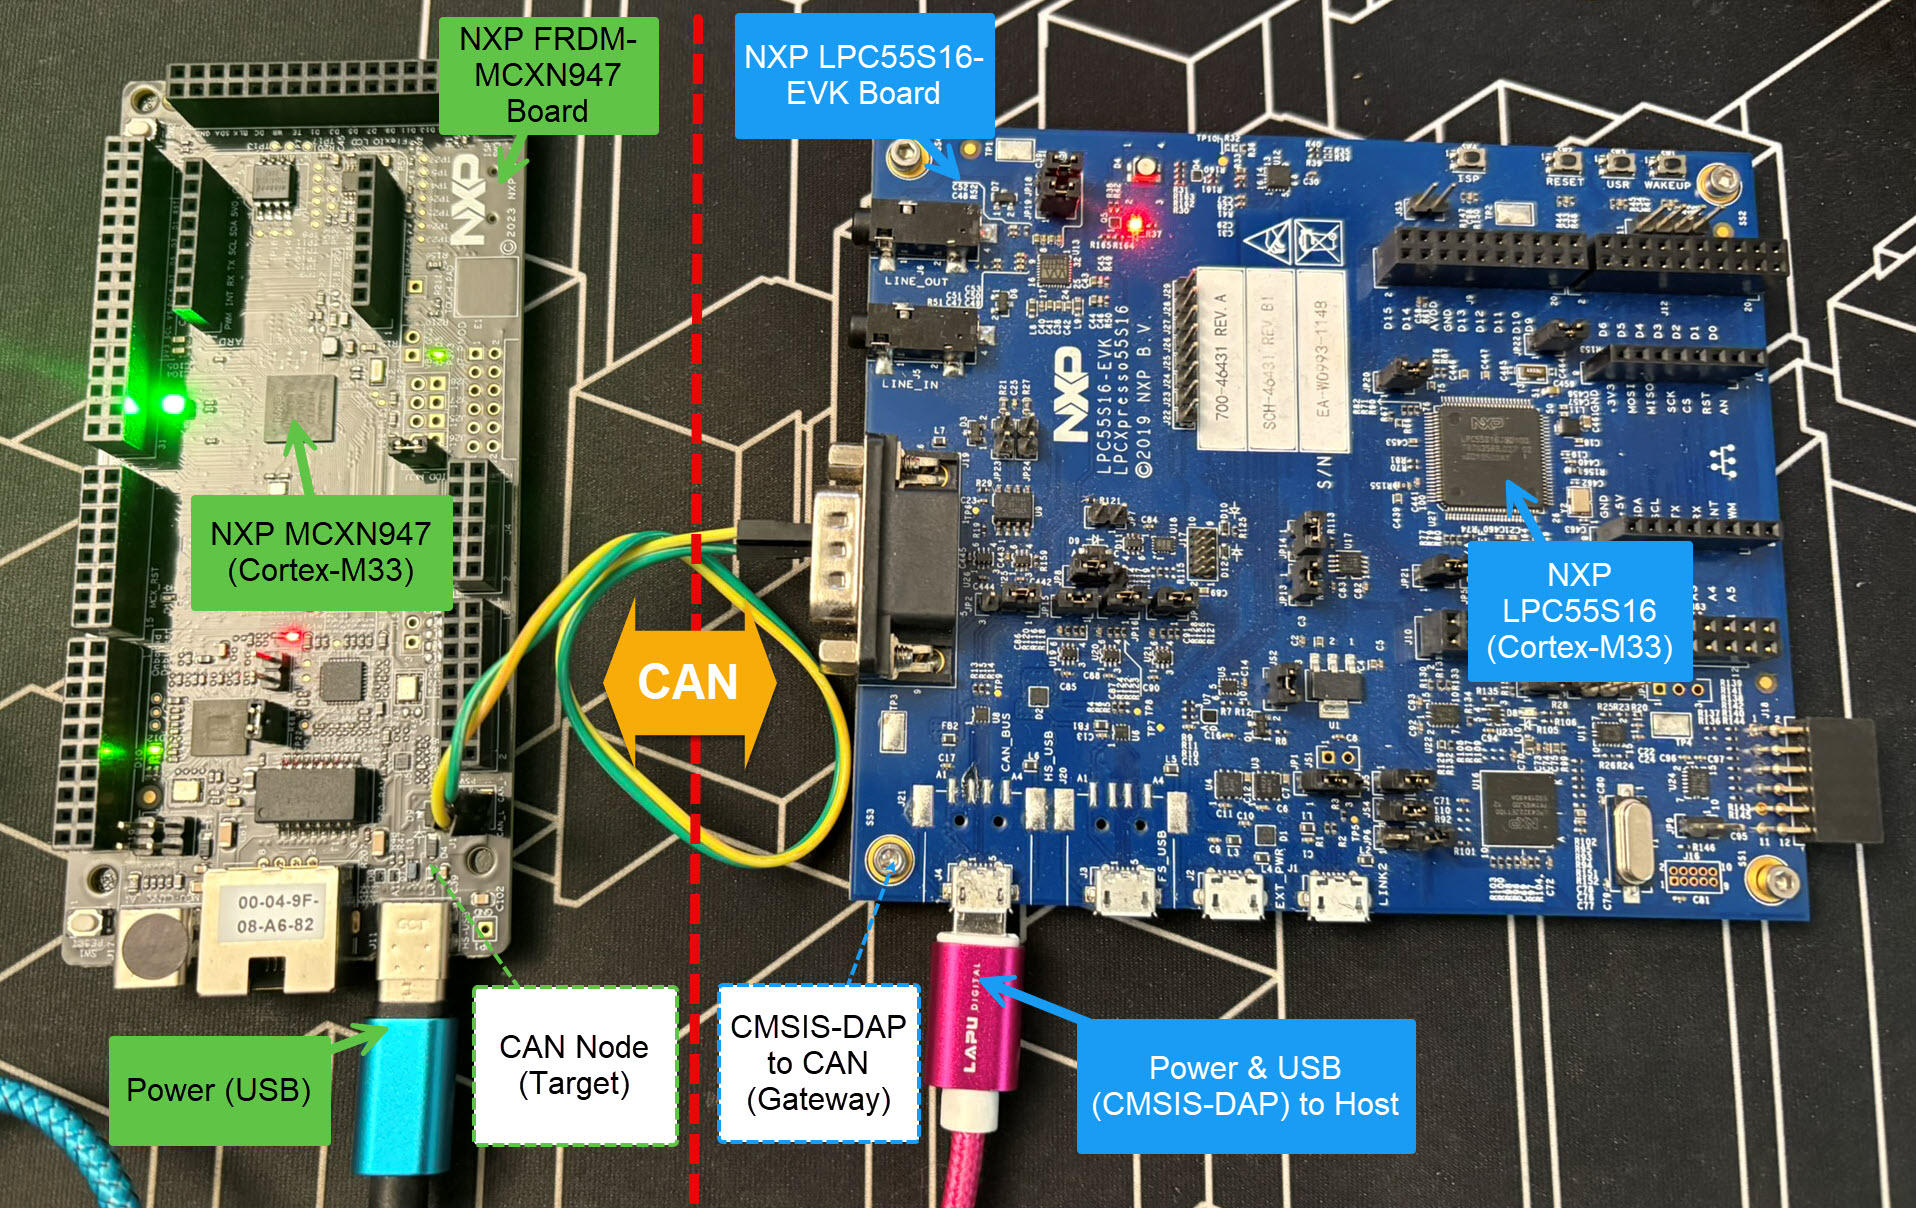
Today’s projects and systems get more and more complex. Many systems include multiple MCUs, connected with a field bus or network, for example CAN. For example there can be up to 70 CAN nodes in modern cars. Such larger and connected systems are a challenge for debugging.
Traditional hardware debugging requires a hardware debug probe, connected with a dedicated SWD/JTAG debug cable to the target device. This needs dedicated pins on the target device plus physical access to the device itself. In many cases, this is not possible in the final product. The hardware debug probes, cables, pins and high speed signals are costly. And worse they can introduce new problems and are prone to interference.
If there is a field bus like CAN connecting all the MCUs, why not use it for hardware debugging? Hardware debugging meaning programming the FLASH memory, halt the MCU, inspect the memory and registers, and step through the code?
Cortex-M Hardware Debugging over CAN
Yes, we can! With the help of a rather unknown hardware feature on ARM Cortex-M devices. We can use the ARM DebugMonitor Interrupt to control and debug the target system. As we would use a JTAG/SWD connection. Instead, we use the CAN bus :-).
SonarQube from Sonar is a free static analysis tool for VS Code. It is able to analyze the source code and find issues. SonarQube does a similar job as other static analysis tools like CppCheck for VS Code.