At the same time, I’m using the cortex-debug extension for other ARM Cortex-M based MCUs, for example the Raspberry Pi Pico series.
Does it makes sense to use cortex-debug for NXP devices, and what would be the benefit? More precise: can I use the NXP MCU-Link (LinkServer based) debug probes with cortex-debug, to debug another NXP MCU?
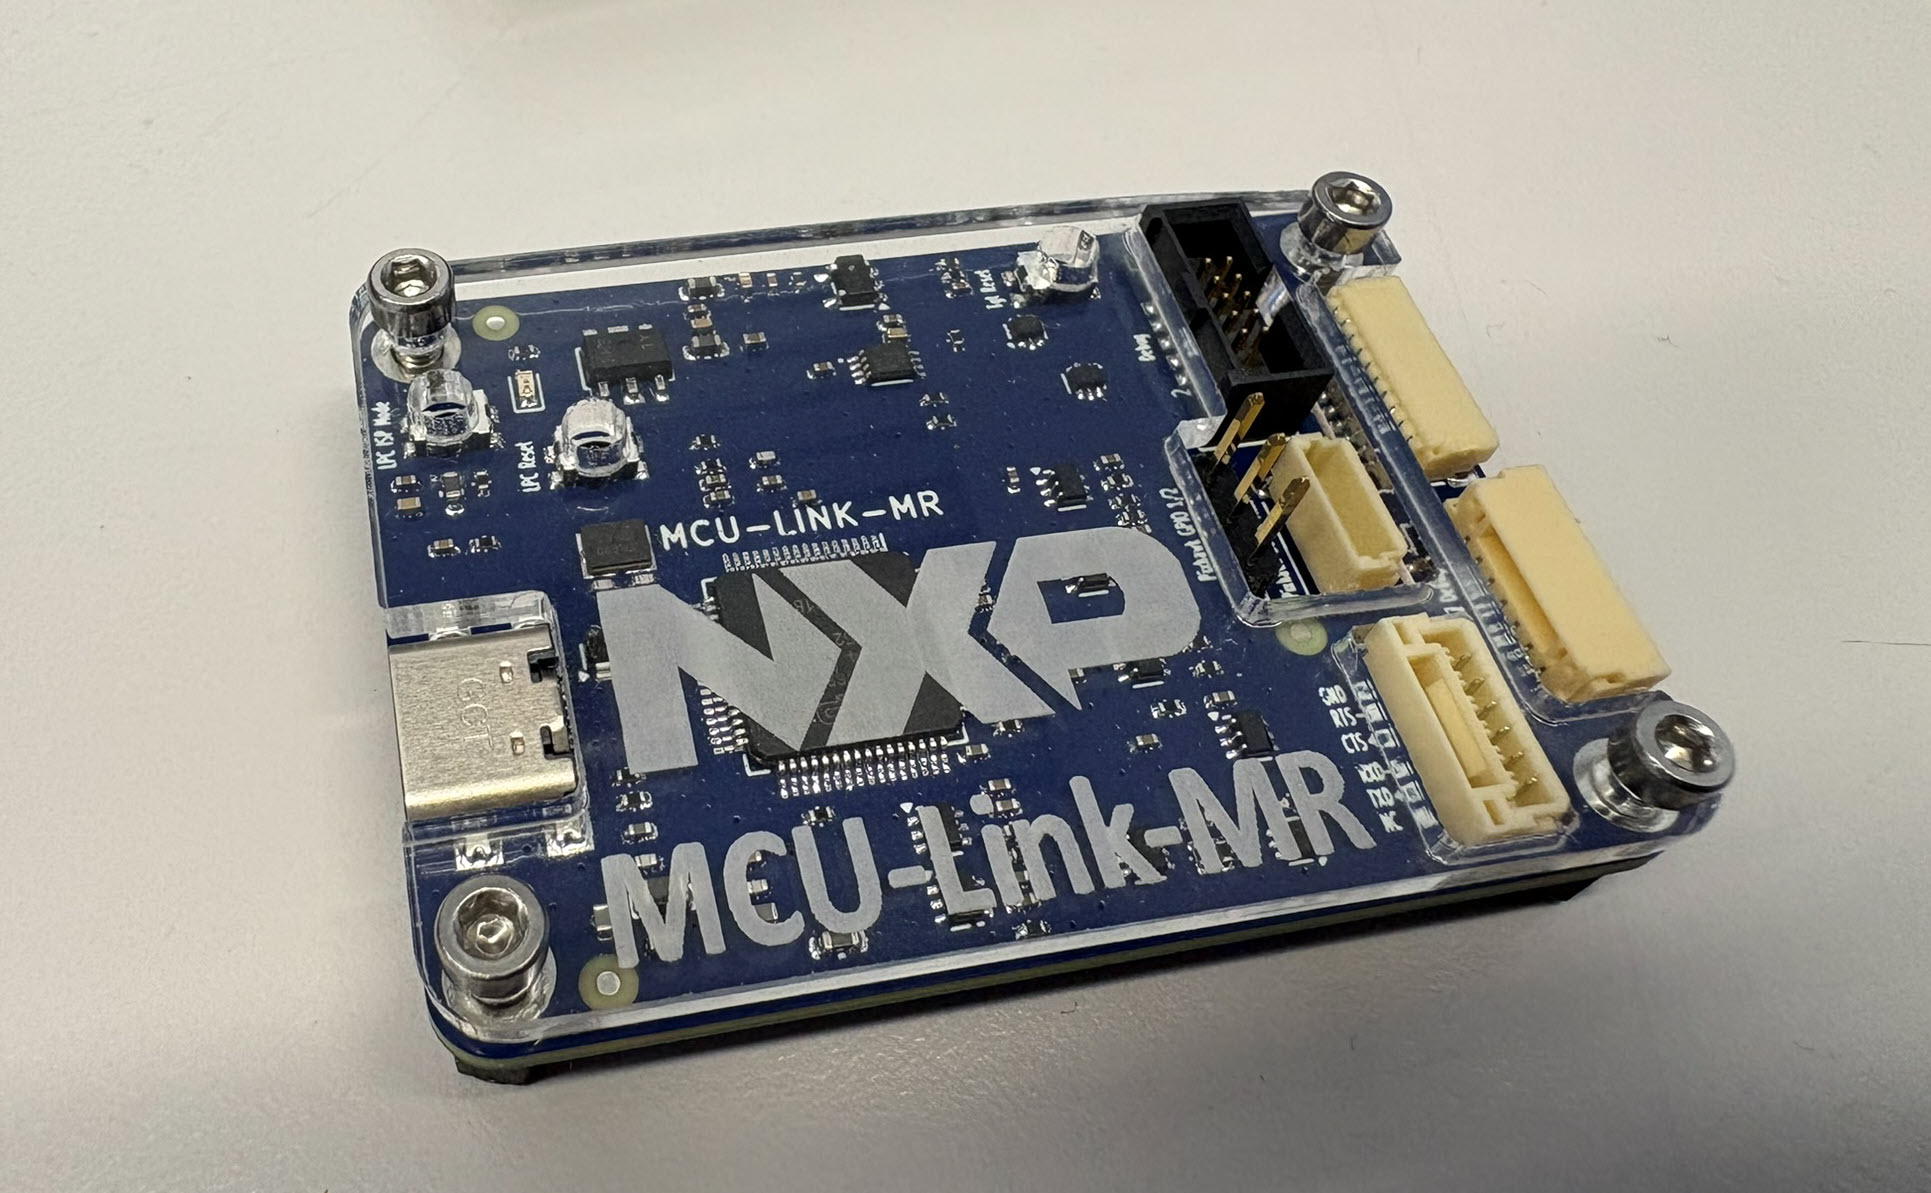
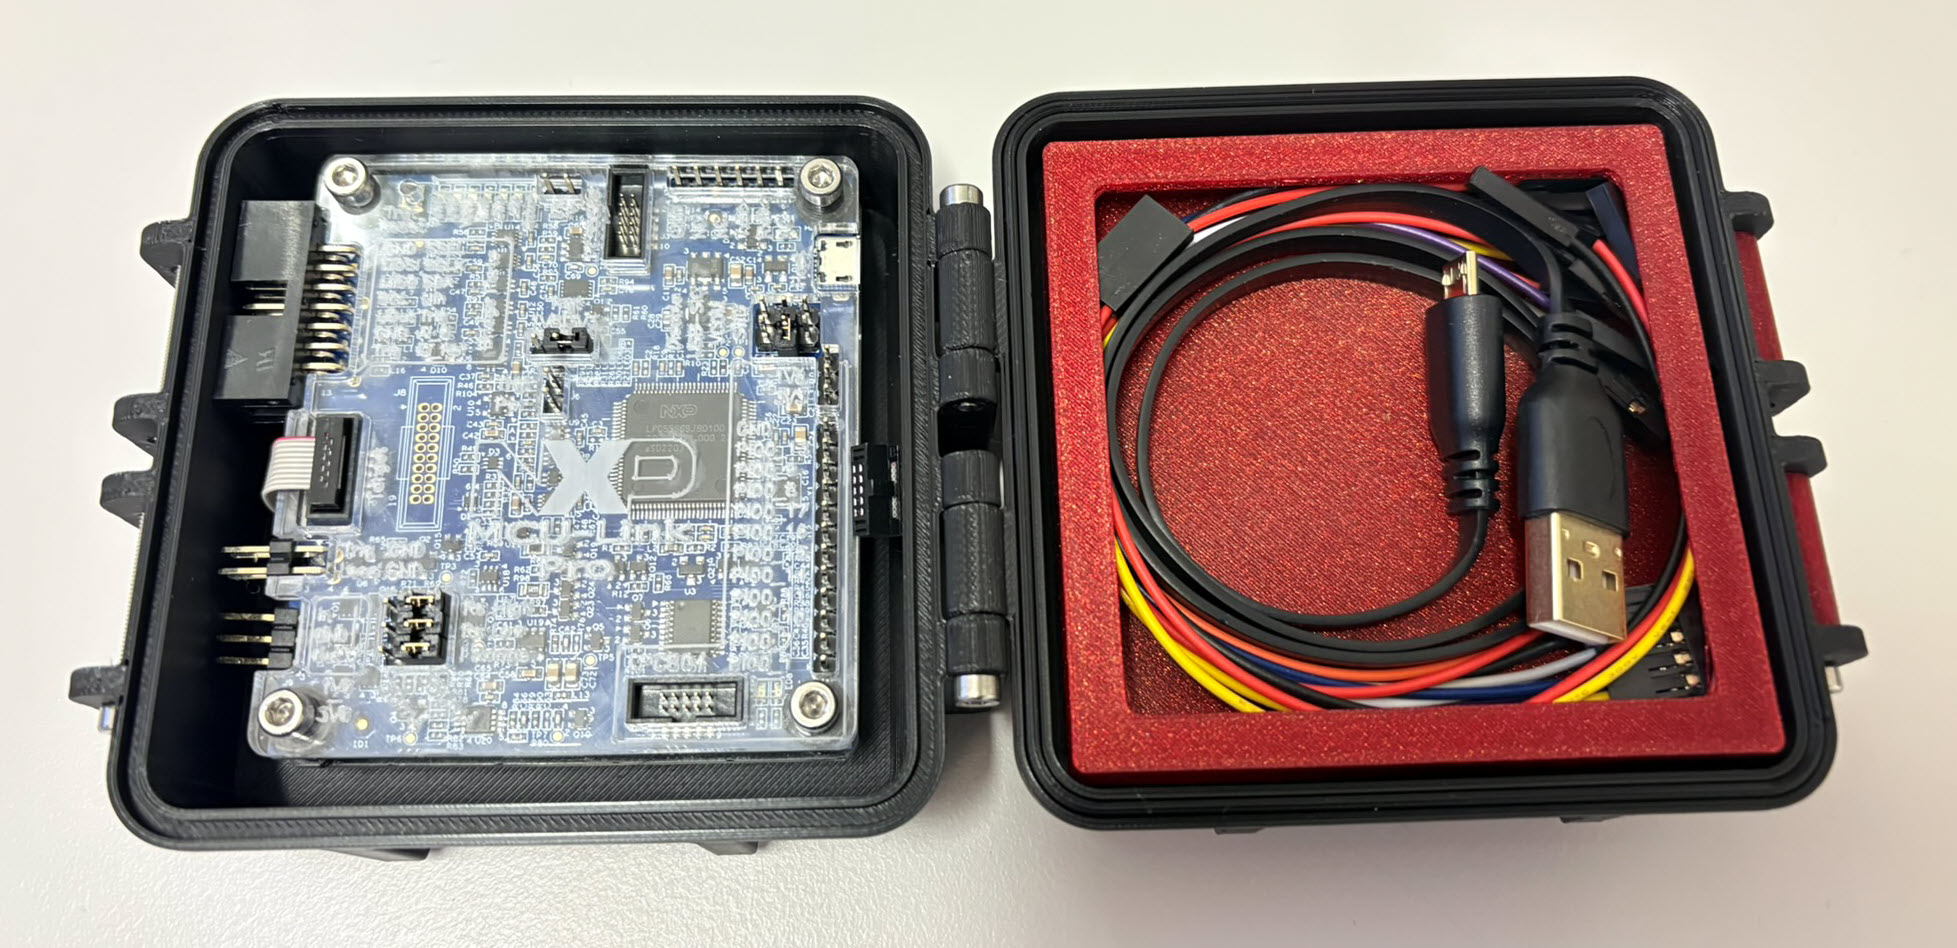
NXP MCU-Link (right) debugging a NXP MCU-Link Pro (LPC55S69, right)Continue reading →
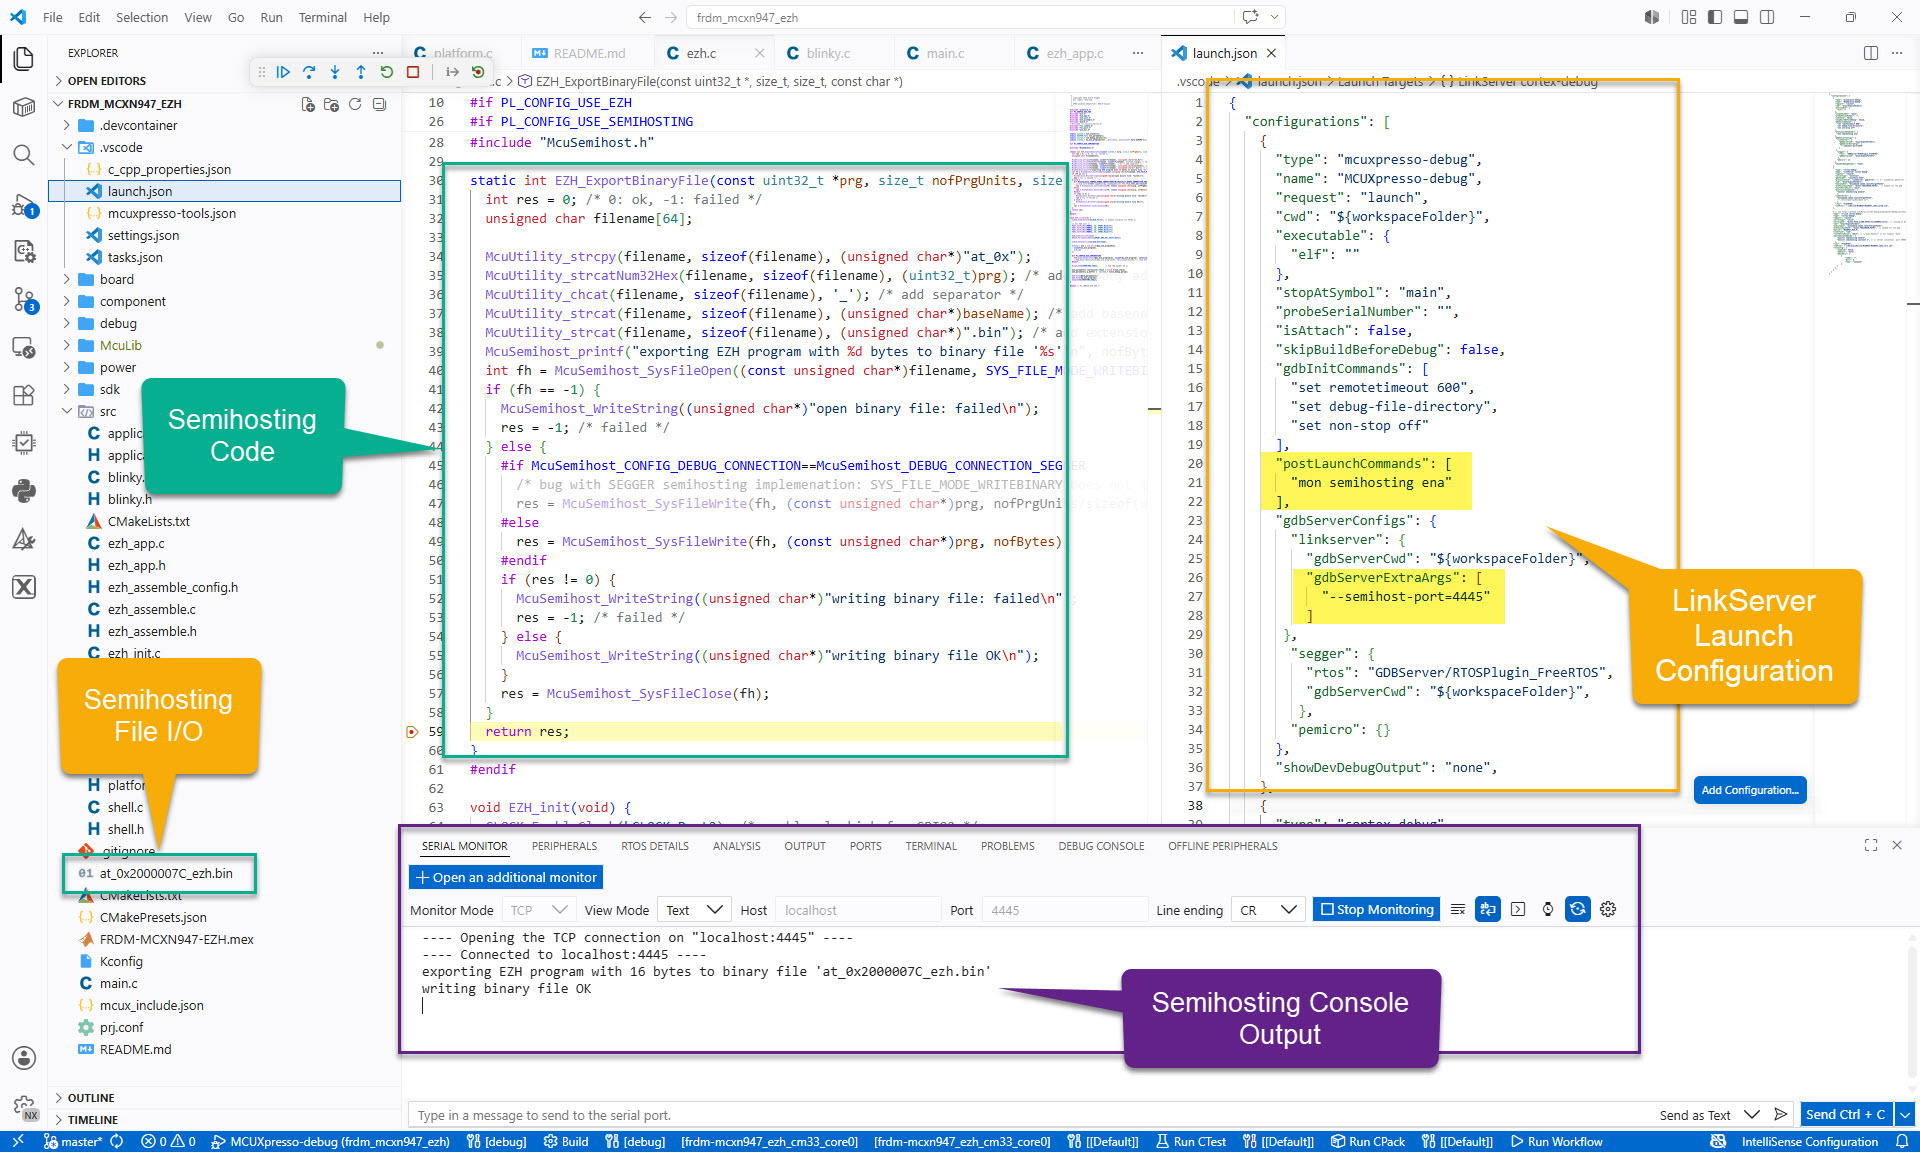
For an university research project, I need to write some console output and the same time write a file with data from the embedded board to the host. A logical choice for this is using semihosting.
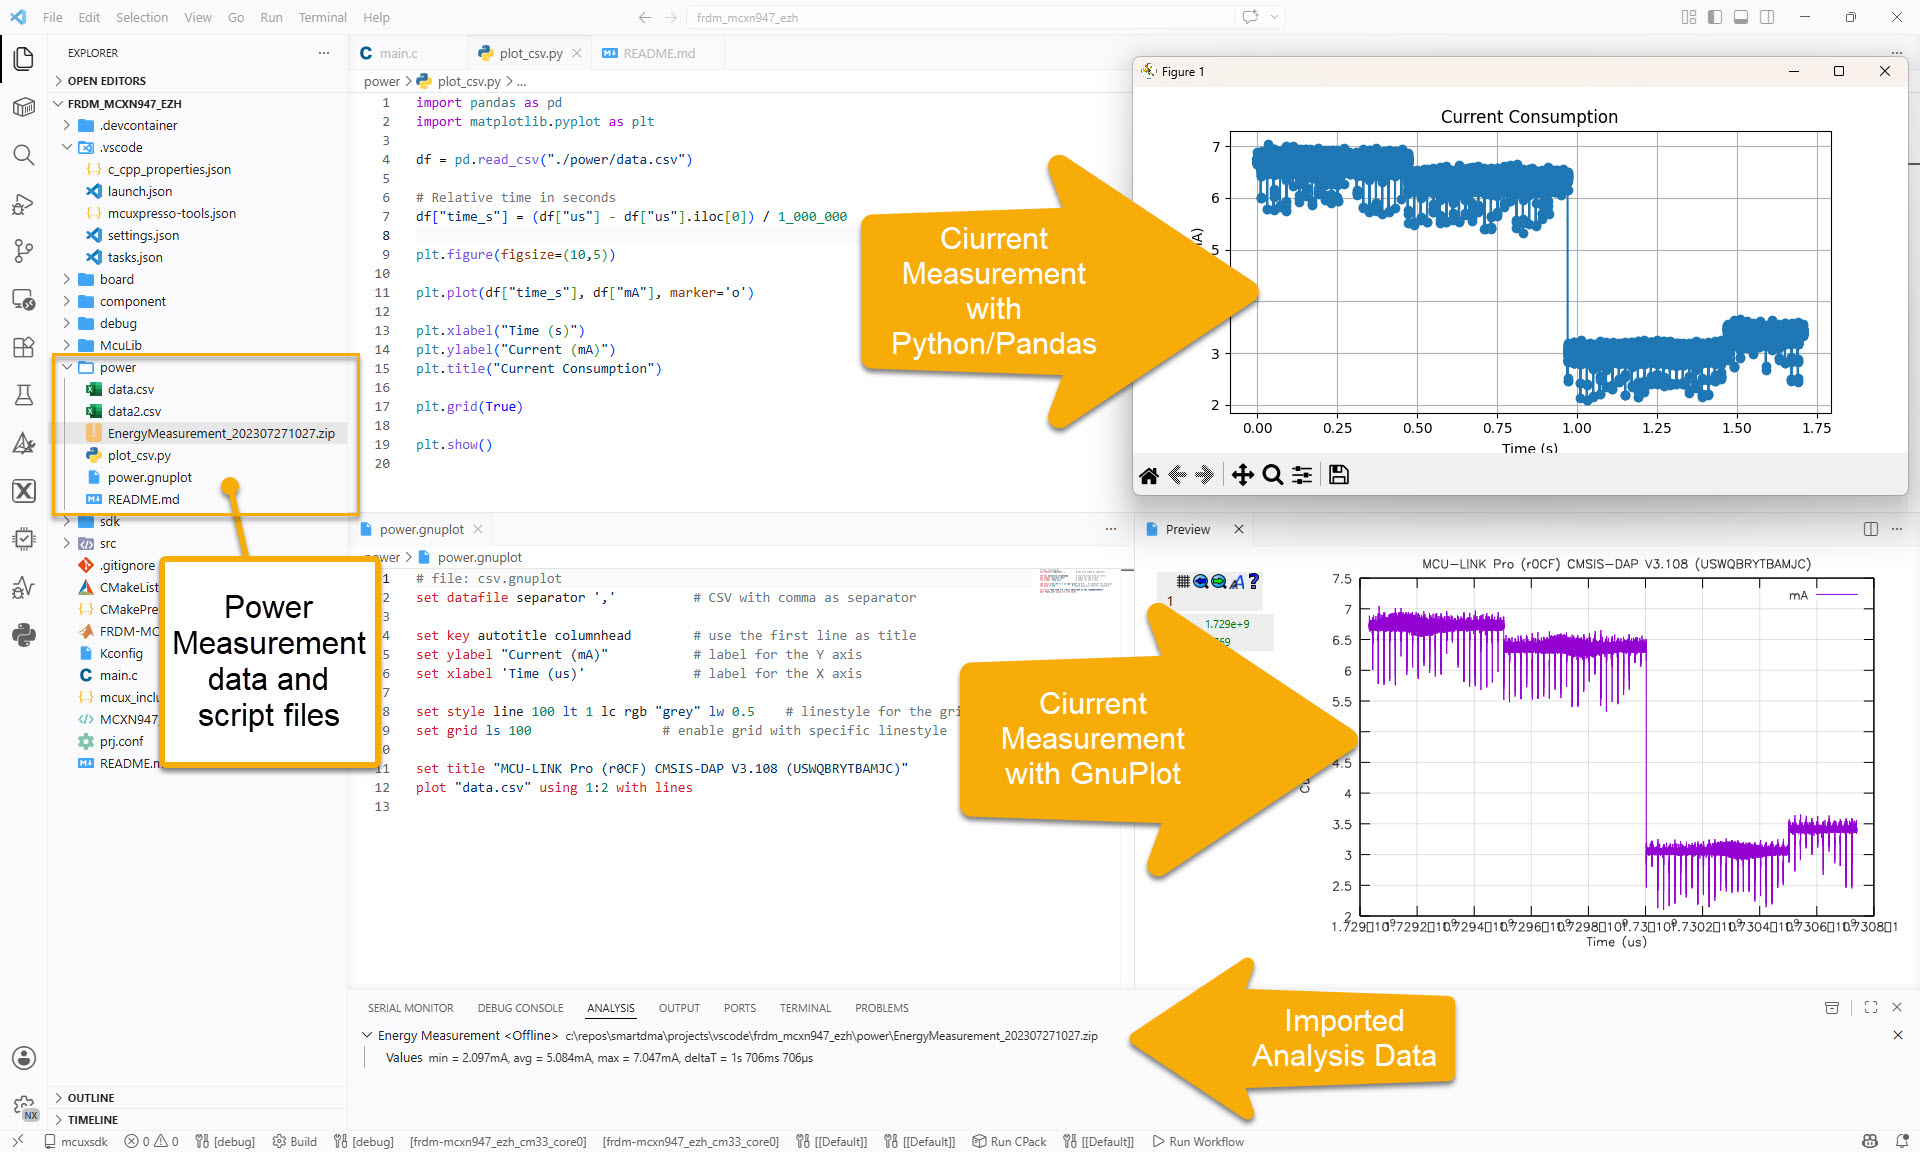
With the NXP MCU-Link Pro I can measure current and power/energy of an embedded target. In this article I describe how I can use and visualize that data in VS Code:
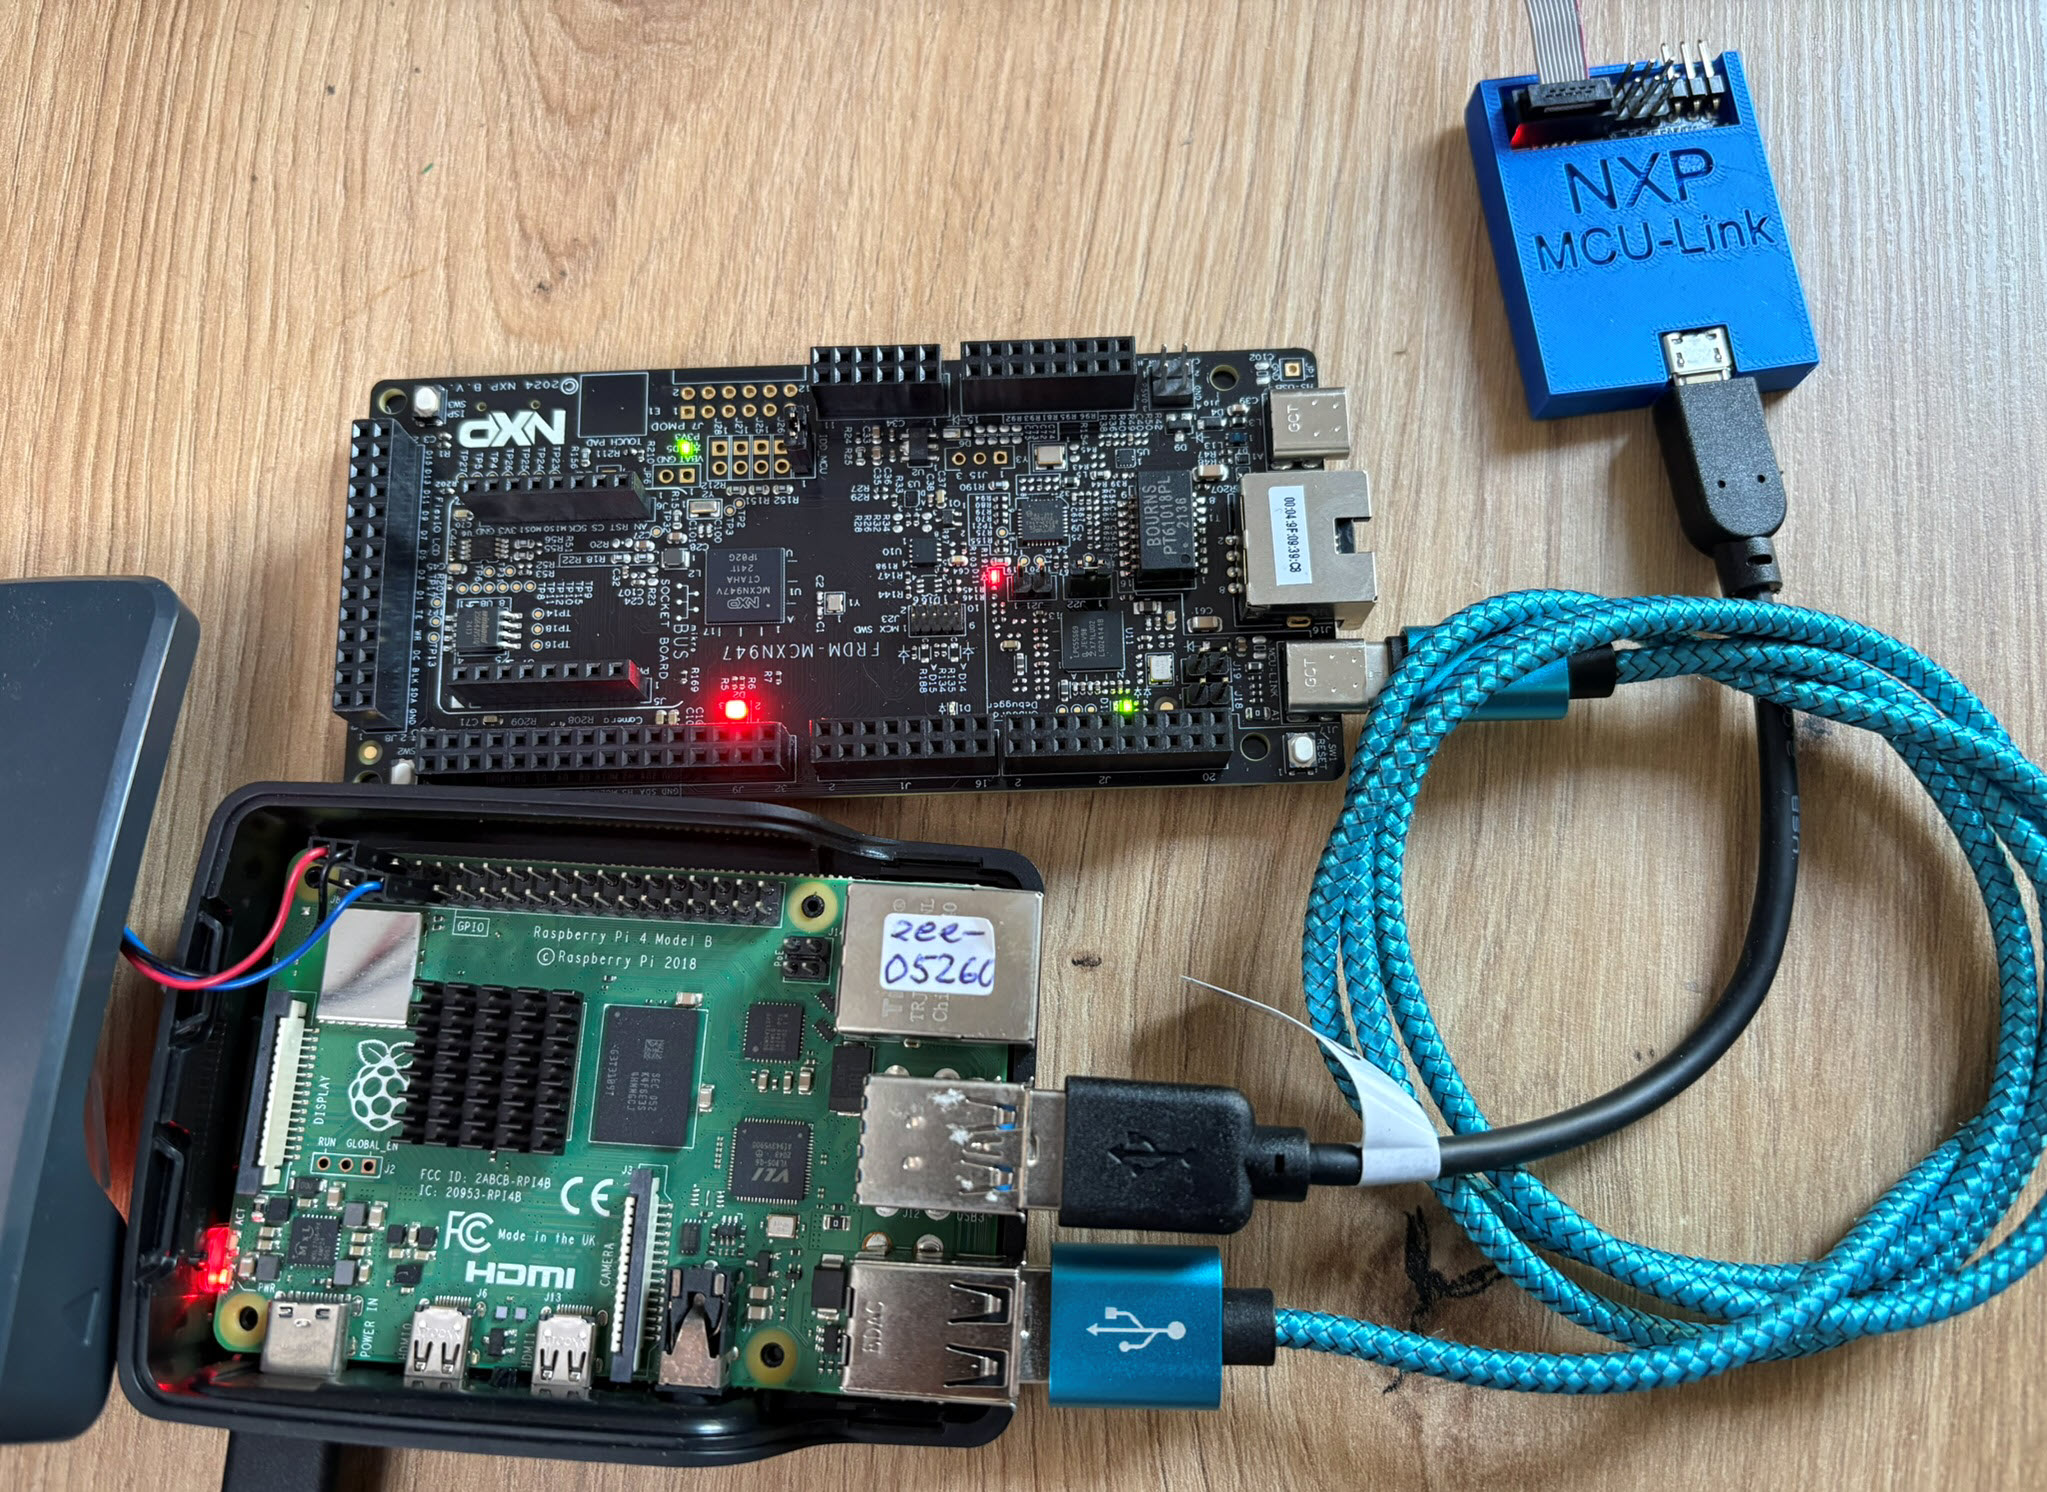
The latest release of the NXP LinkServer supports ARM 64bit (Debian) besides Windows, Linux and MacOS. With this, I can now develop on an NXP i.MX board. Plus, this enables an inexpensive way for automated on-target tests and CI/CD.
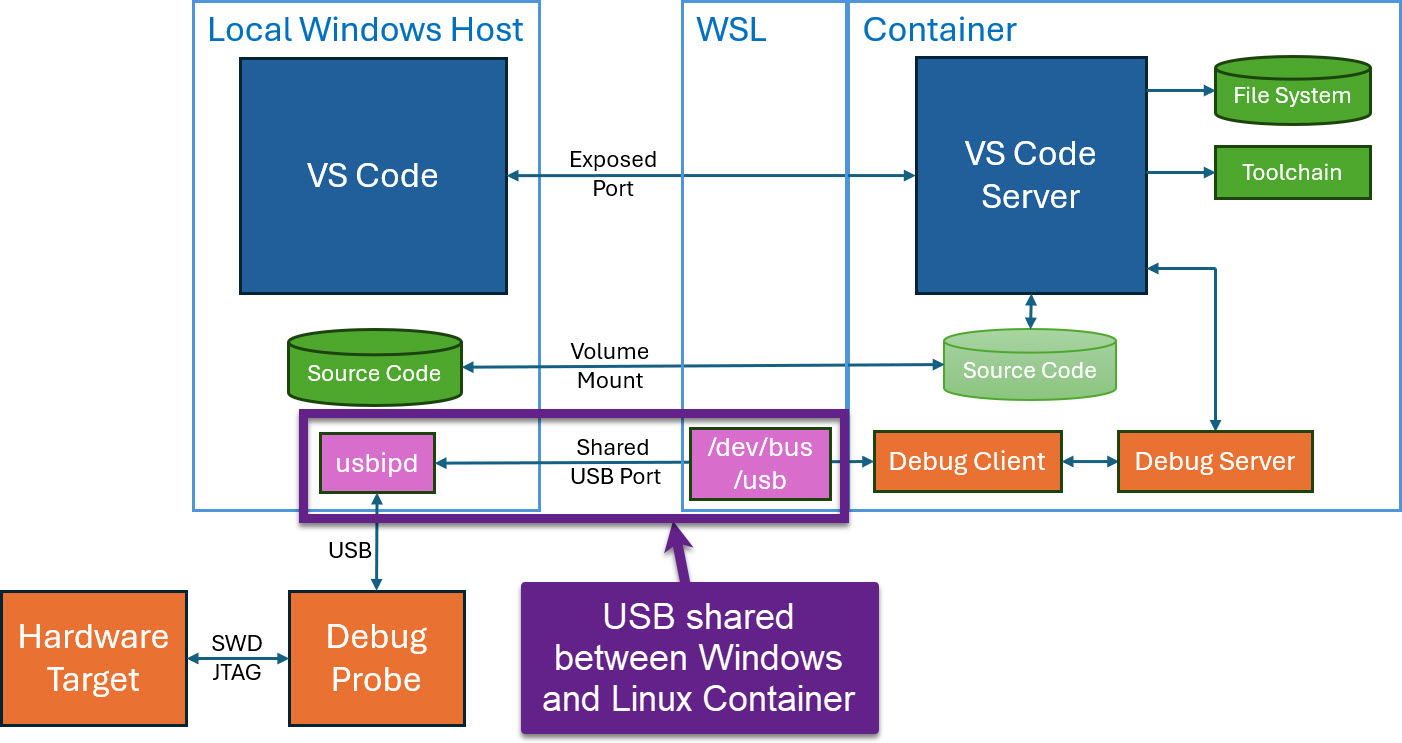
Docker or Development Container are great for isolation. And they work very well with things outside which are TCP/IP based. But most debug probes are USB only. Docker container don’t work well with USB. In Remote Debugging with DevContainer and VS Code, I showed how to use USB based debug probes. I demonstrated using them with an IP connection. In this article I show how Windows USB devices can be used from a container, with the help of usbipd.
The Rust programming language is making its way into different areas: Rust gets added to the Linux Kernel. I see an increasing interest for using Rust in embedded projects. And Rust is used for embedded tools. I noticed this with the latest LinkServer v25.09 release: there is a new tool included in the package, rblhost.
rblhost on crates.io
The release note just mentioned:
- Switched to using rapid blhost (rblhost) utility.
This triggered my interest, and actually that utility is implemented in Rust :-).
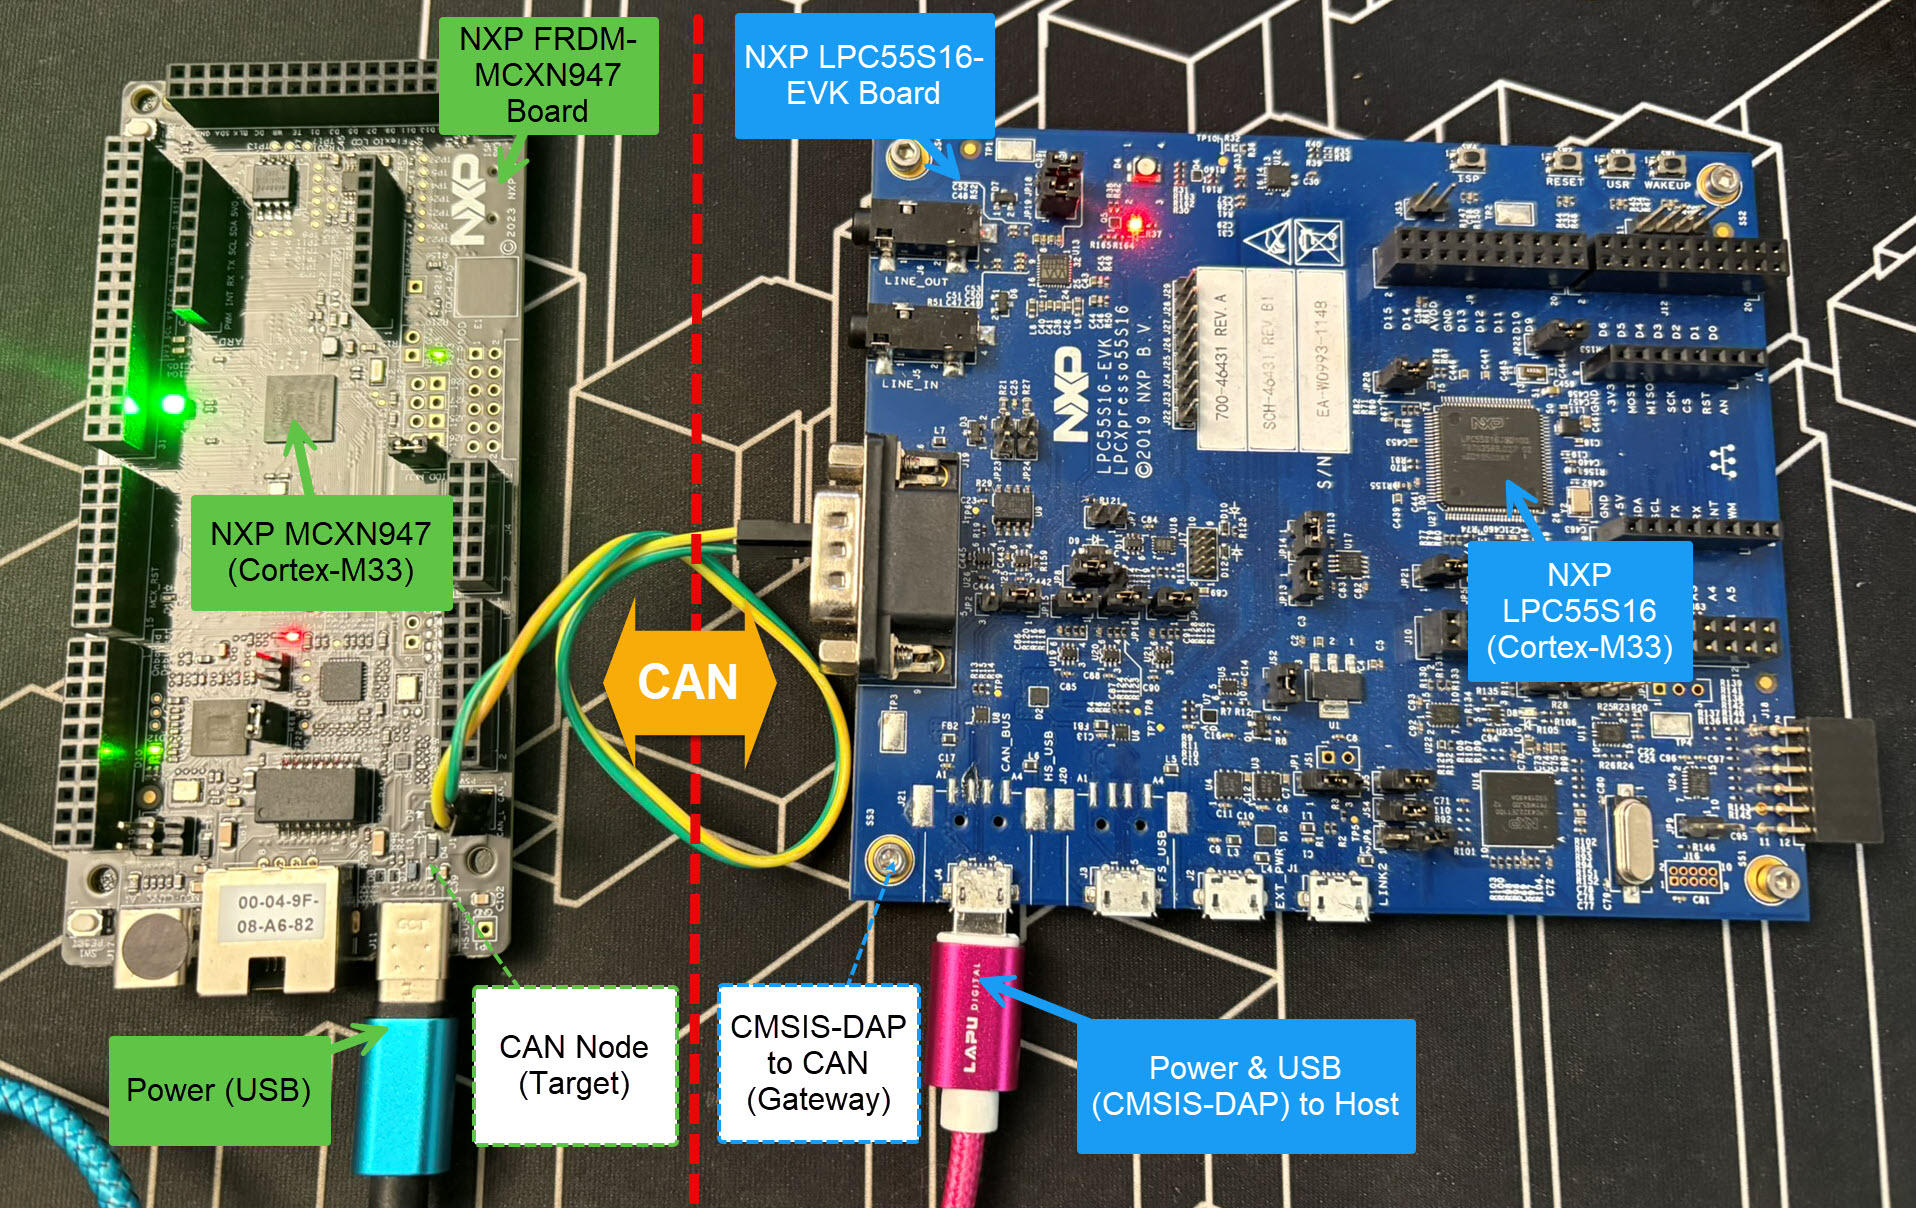
Today’s projects and systems get more and more complex. Many systems include multiple MCUs, connected with a field bus or network, for example CAN. For example there can be up to 70 CAN nodes in modern cars. Such larger and connected systems are a challenge for debugging.
Traditional hardware debugging requires a hardware debug probe, connected with a dedicated SWD/JTAG debug cable to the target device. This needs dedicated pins on the target device plus physical access to the device itself. In many cases, this is not possible in the final product. The hardware debug probes, cables, pins and high speed signals are costly. And worse they can introduce new problems and are prone to interference.
If there is a field bus like CAN connecting all the MCUs, why not use it for hardware debugging? Hardware debugging meaning programming the FLASH memory, halt the MCU, inspect the memory and registers, and step through the code?
Cortex-M Hardware Debugging over CAN
Yes, we can! With the help of a rather unknown hardware feature on ARM Cortex-M devices. We can use the ARM DebugMonitor Interrupt to control and debug the target system. As we would use a JTAG/SWD connection. Instead, we use the CAN bus :-).
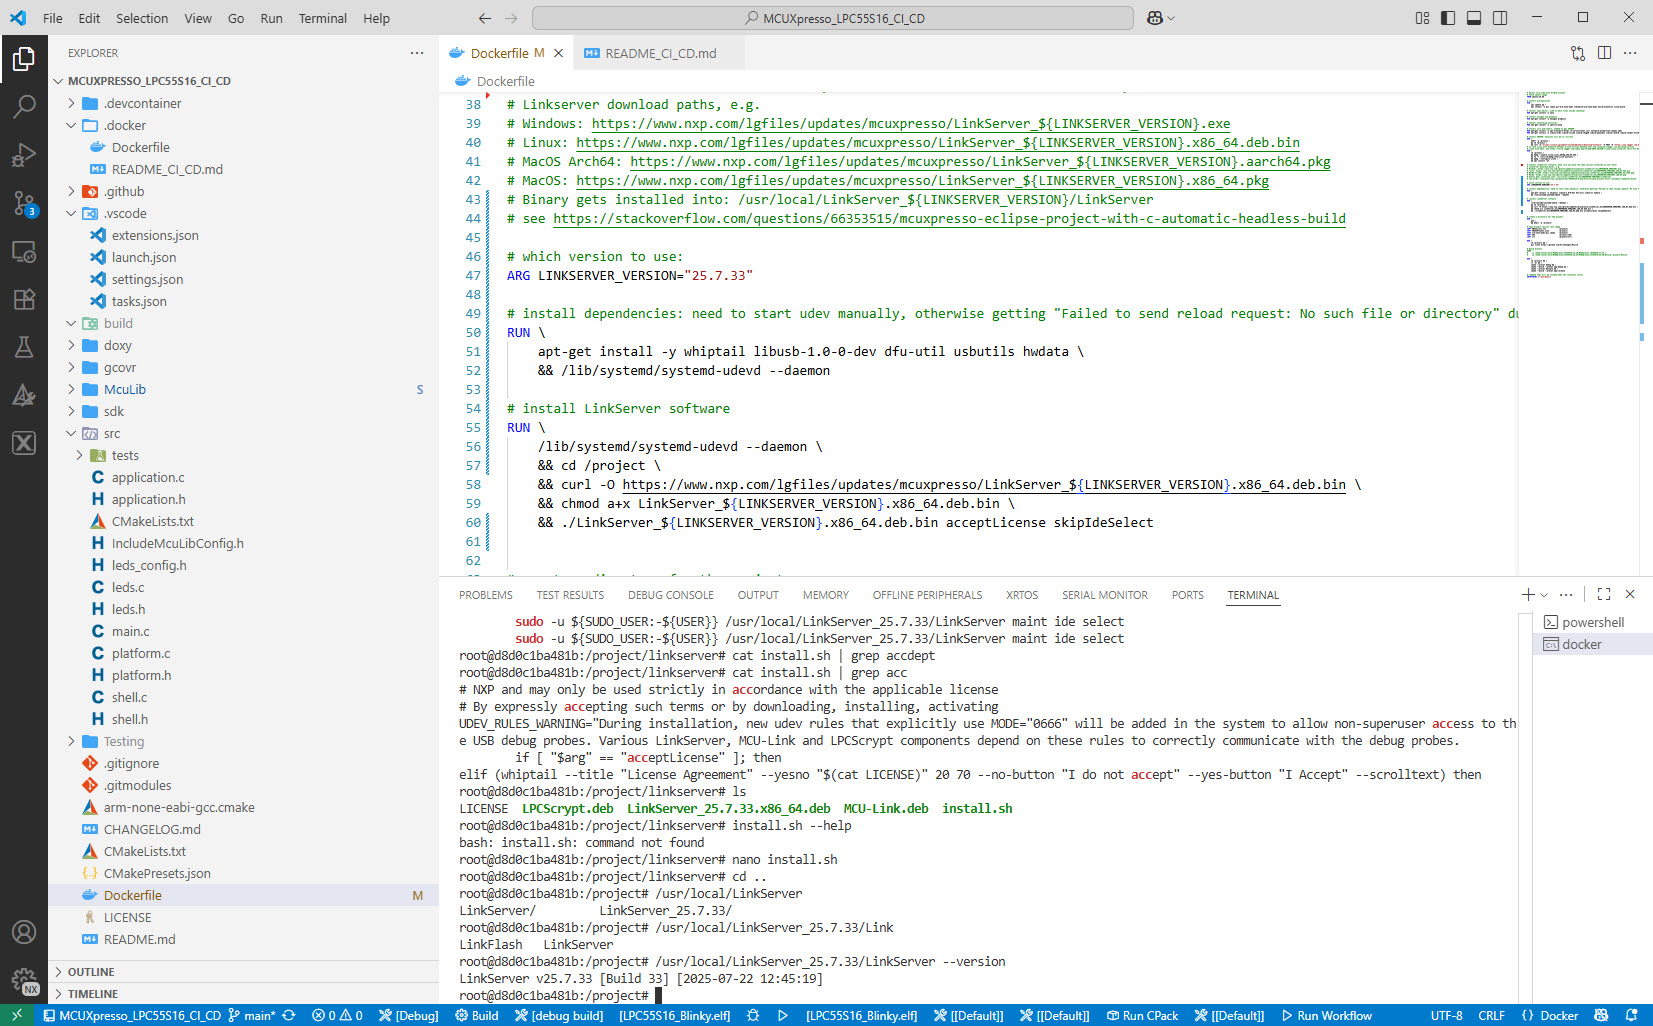
I’m shifting more and more of my CI/CD testing infrastructure using the LinkServer runner. One reason is the LinkServer runner can run the test on-target. It can also collect GNO gcov coverage information at the same time. LinkServer is a suite of software tools for launching and managing GDB servers for NXP debug probes.


 MCU on Eclipse