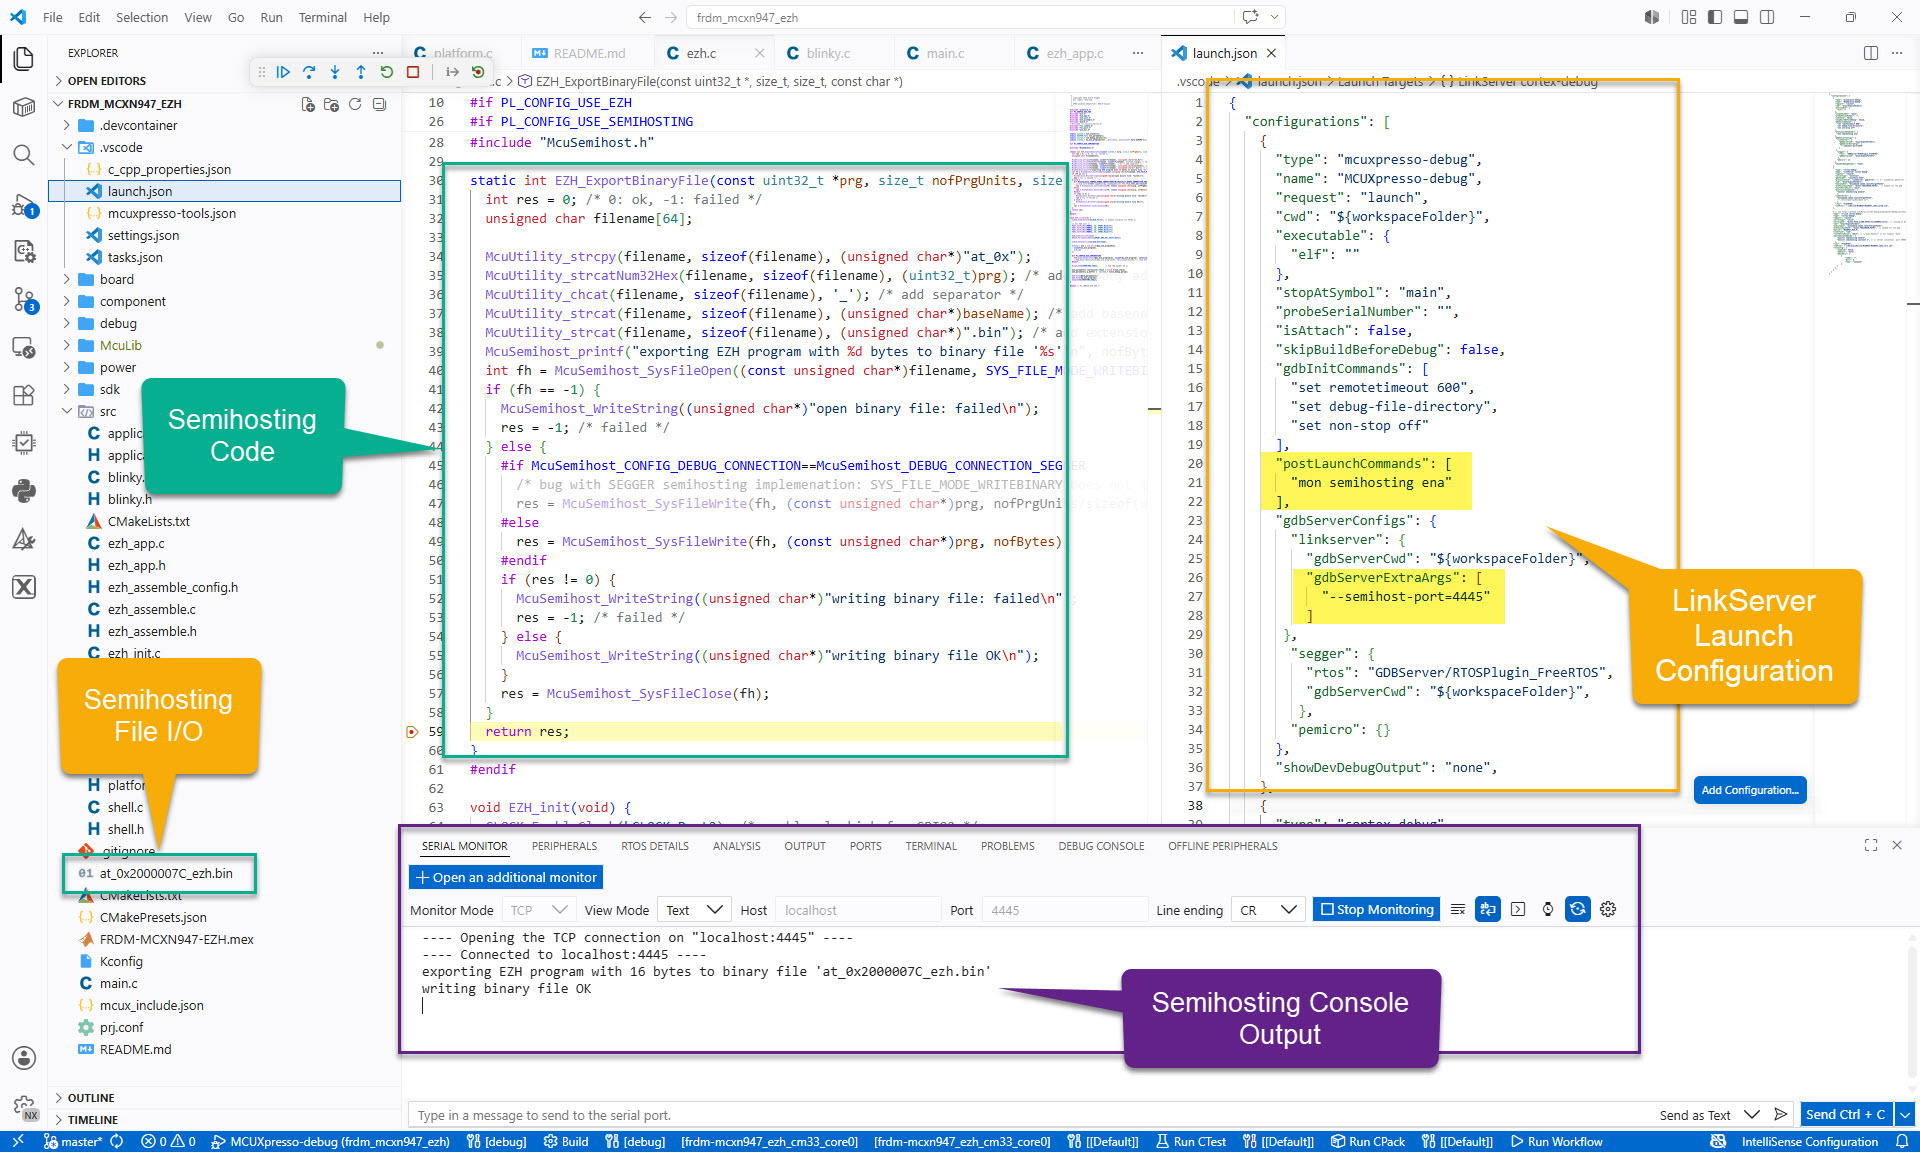
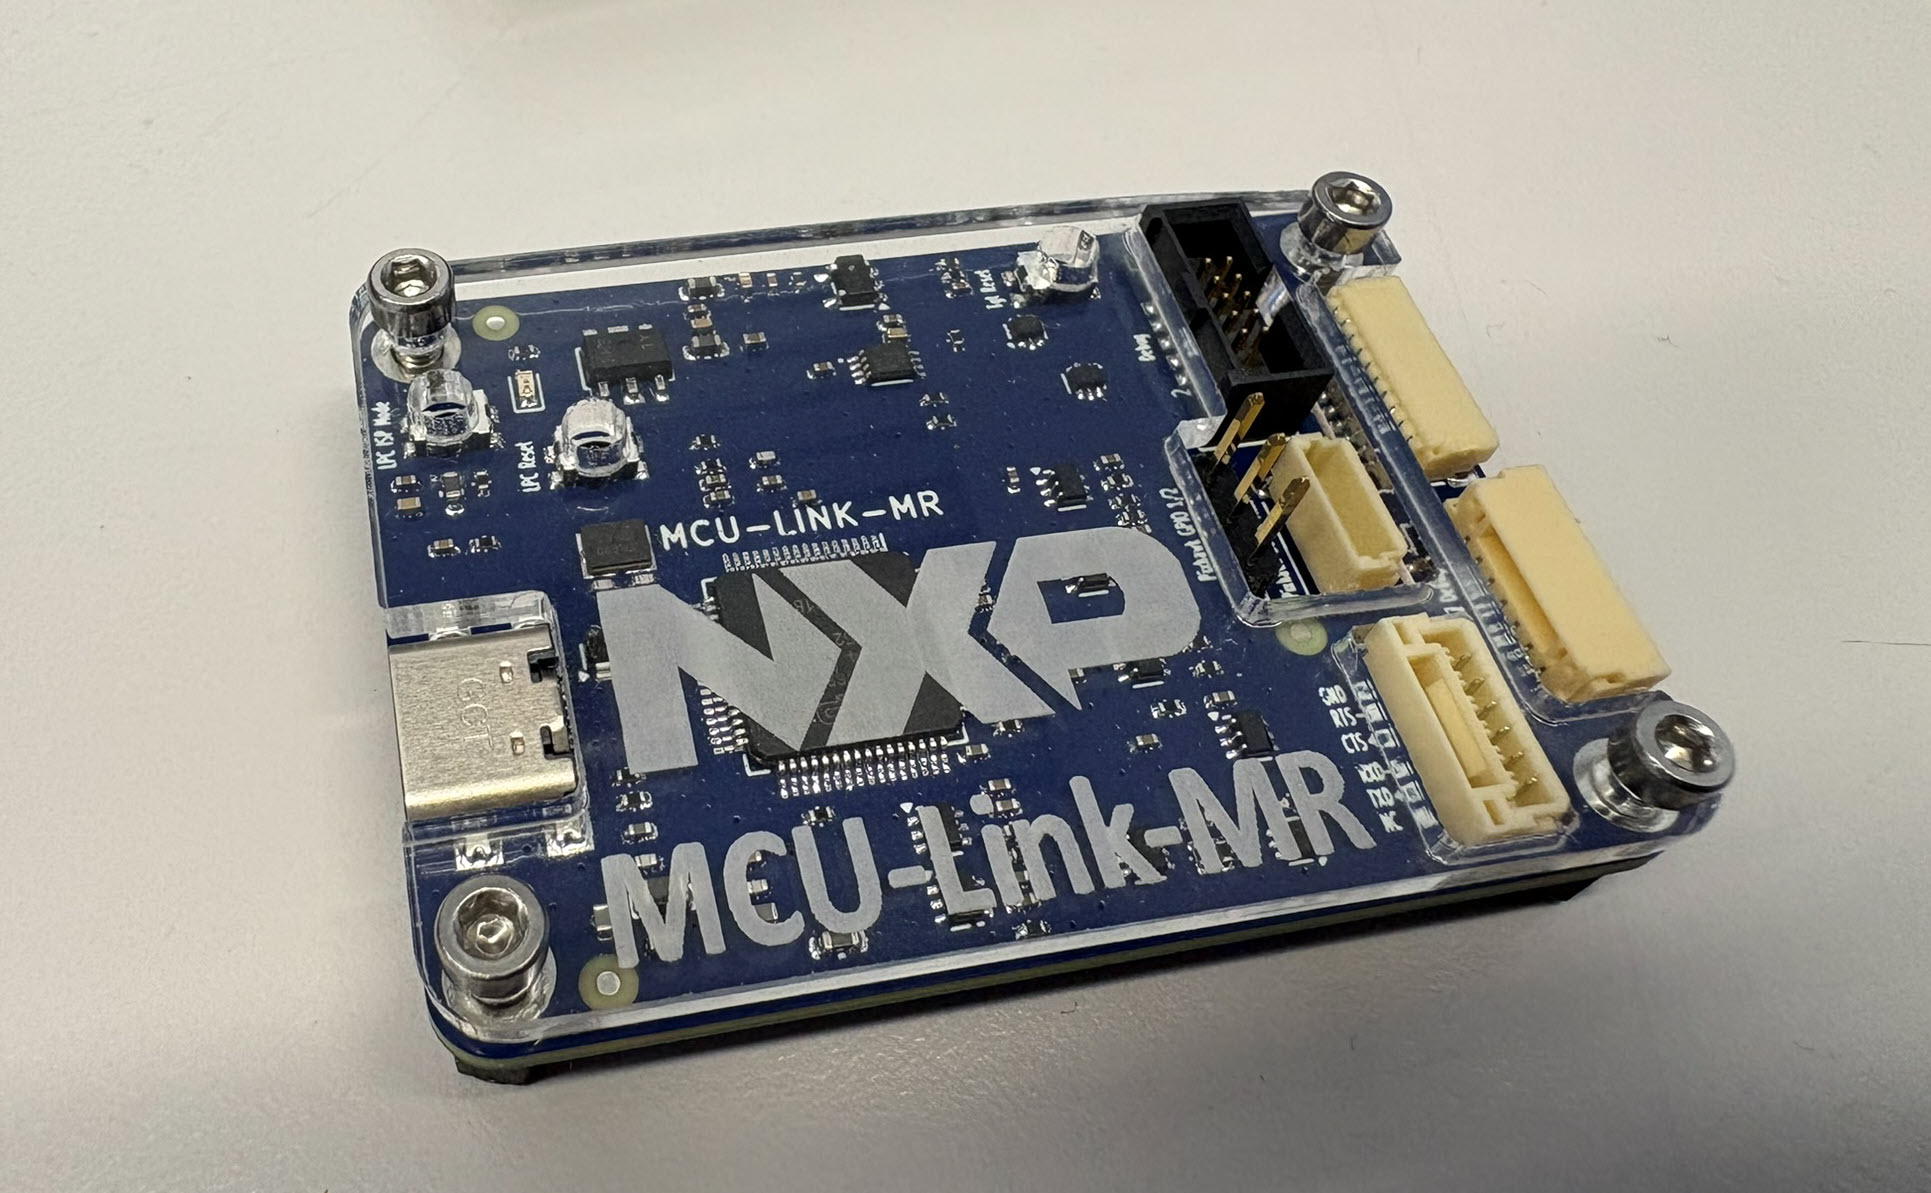
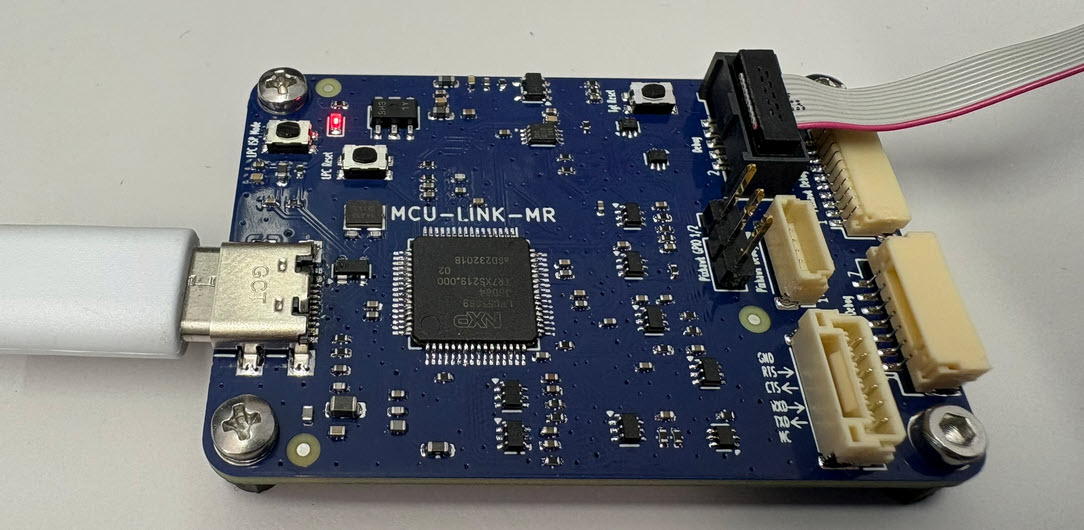
In my latest research project I’m using the NXP FRDM-MCXN947 board. As part of that project I have to collect and export application trace data for later analysis. In that project I’m using the the Tracealyzer product from Percepio.
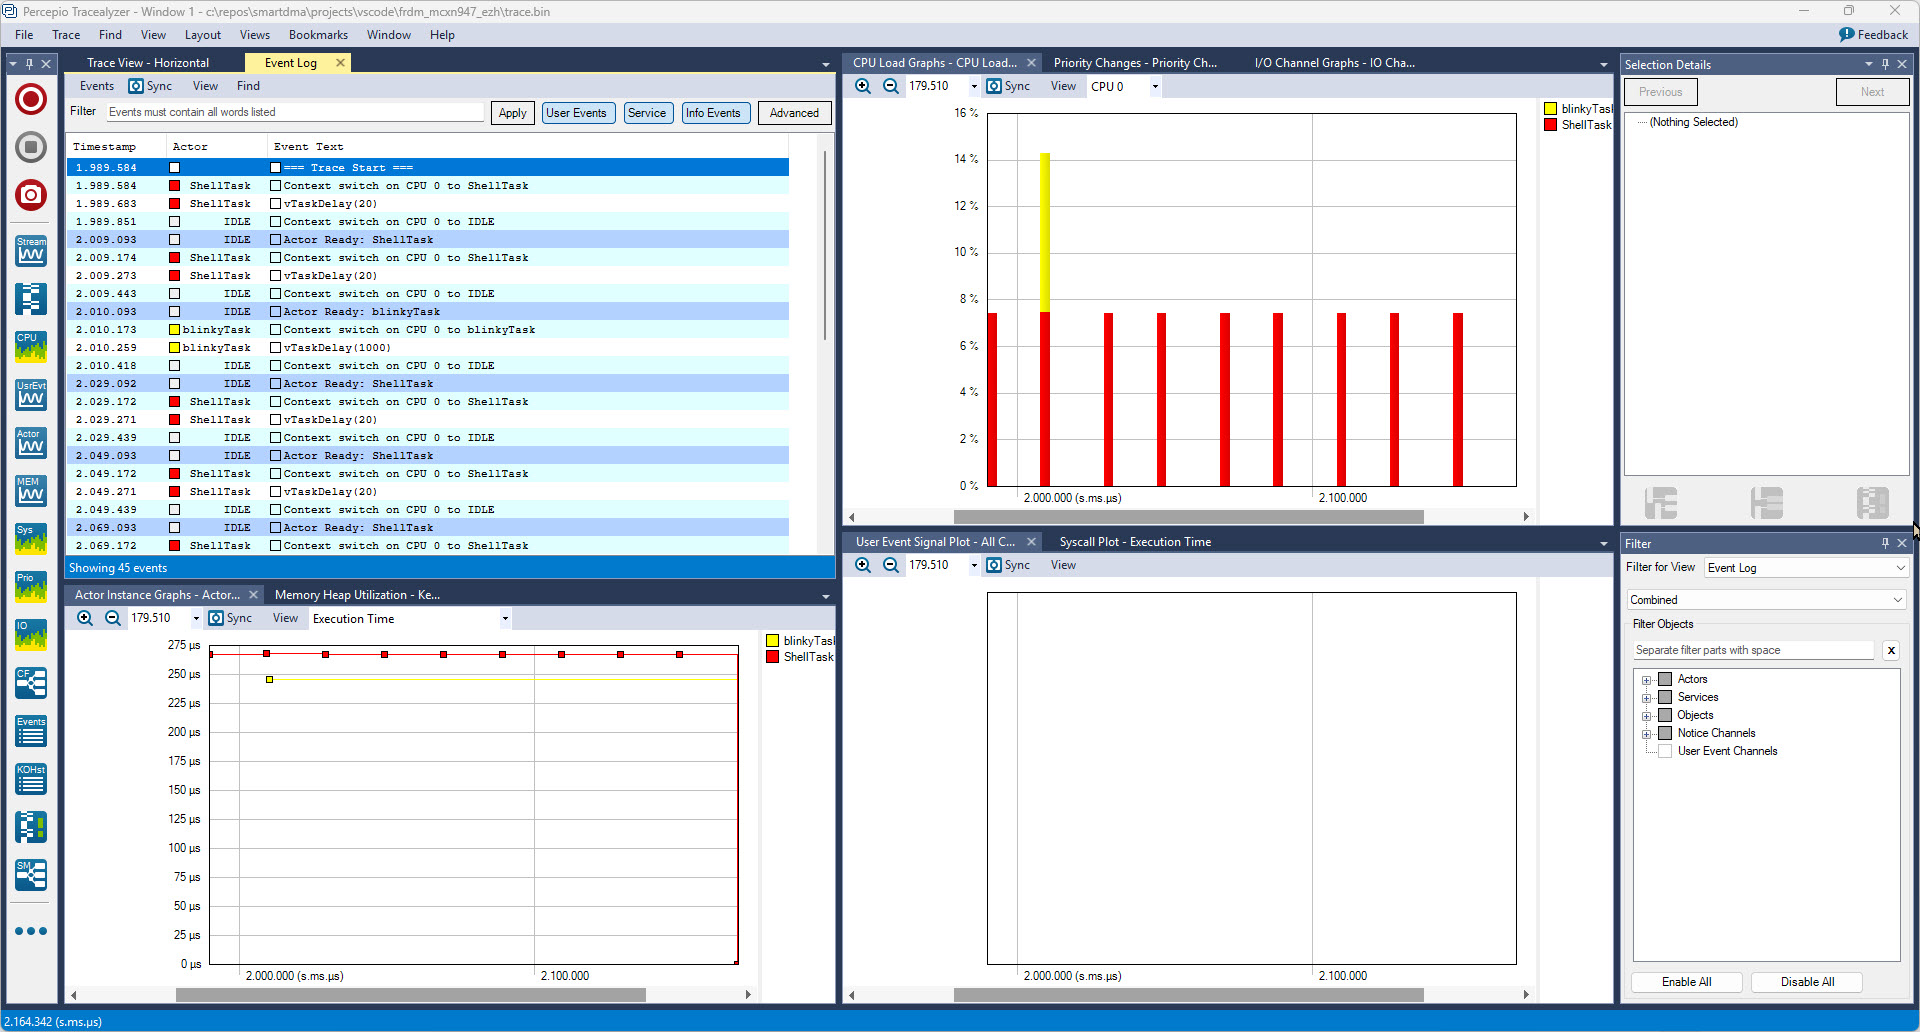
In this article I describe different ways to export trace data from the embedded target: using generic GDB commands or with an trace exporter in VS Code.
Continue reading