Setting up the correct tools for a development environment can be complex and time consuming. I’m using DevContainers with Docker for almost all of my projects. Because that way I get an isolated development environment. For this I spend time to craft dedicated docker files, to have everything installed correctly with the the right versions.
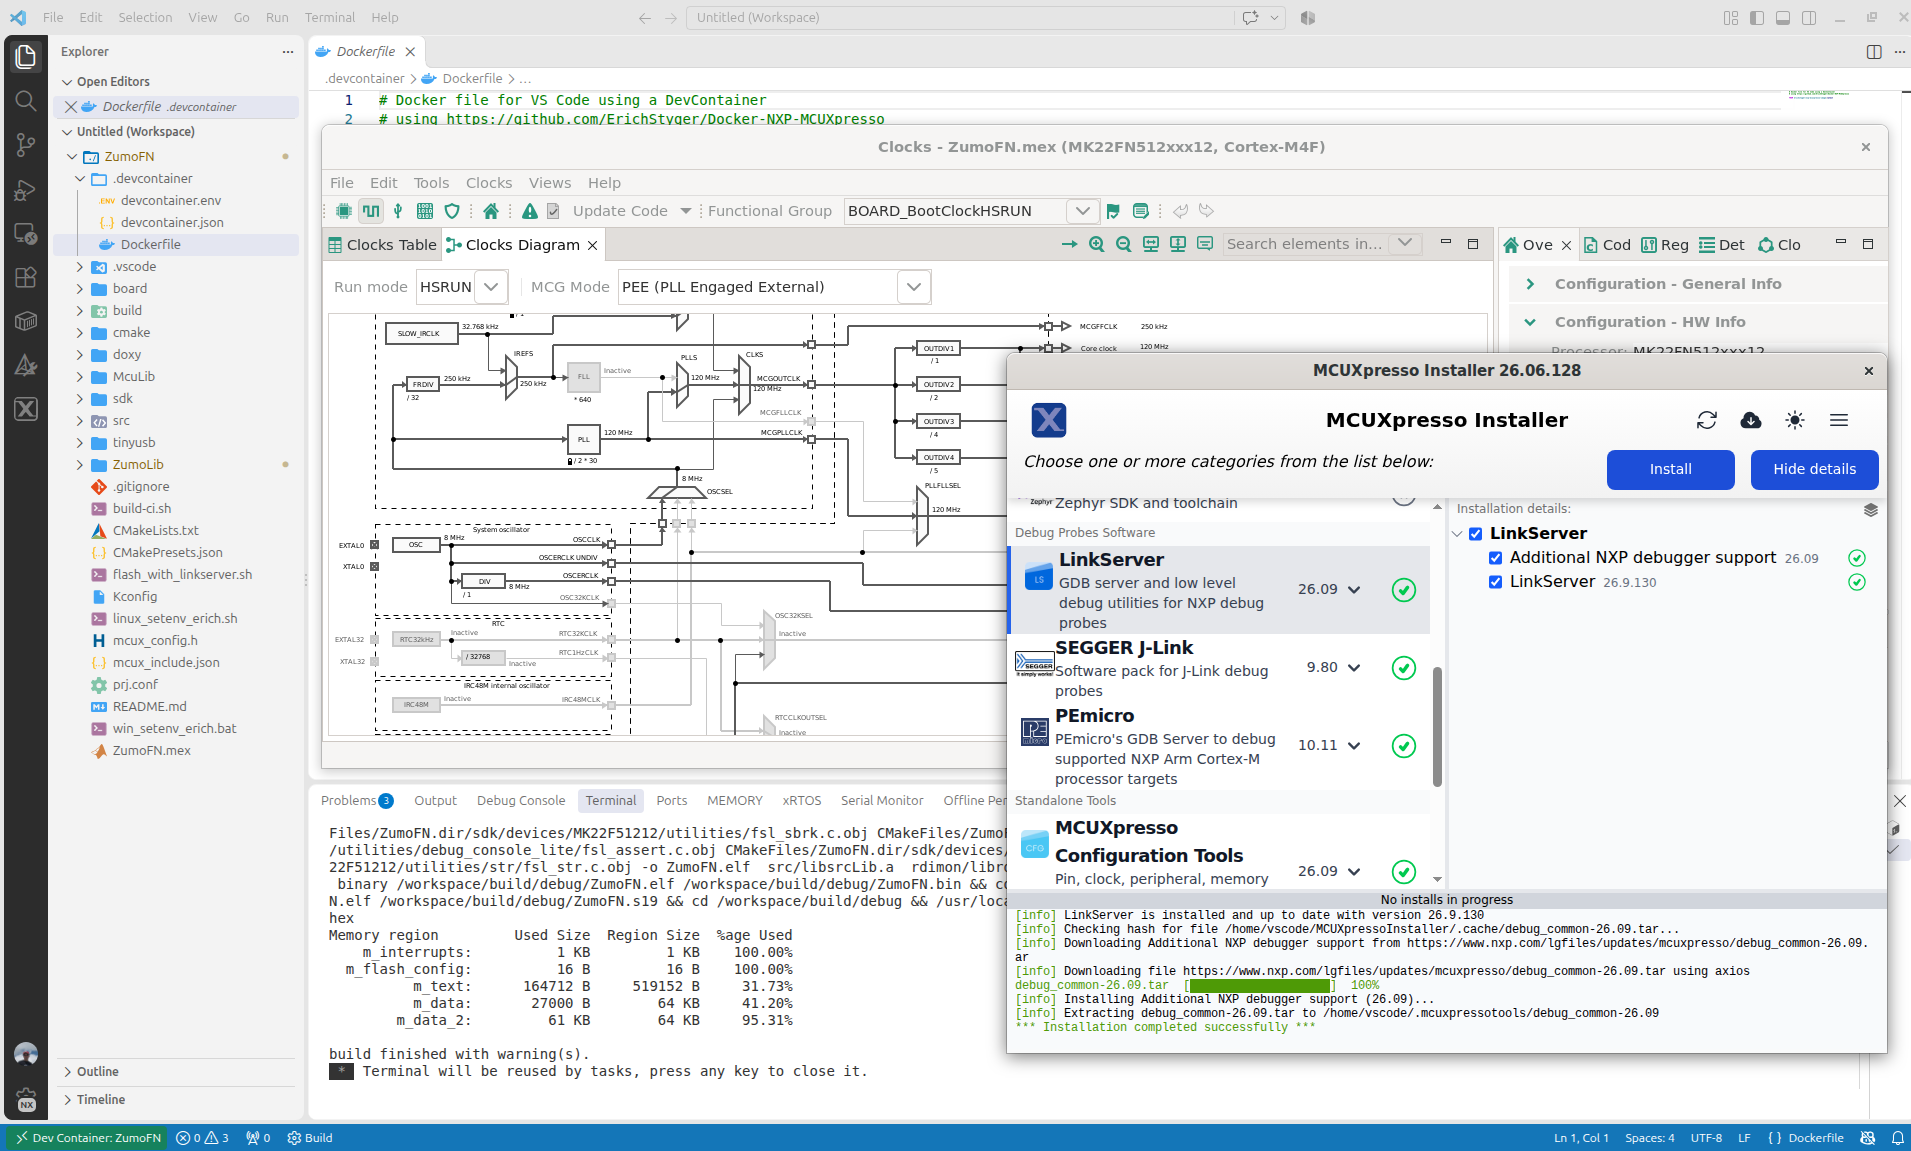
Outside a docker or DevContainer environment, I’m using the NXP MCUXpresso installer. It is a standalone application which can be used from VS Code to check and install all the necessary tools.
MCUXpresso Installer
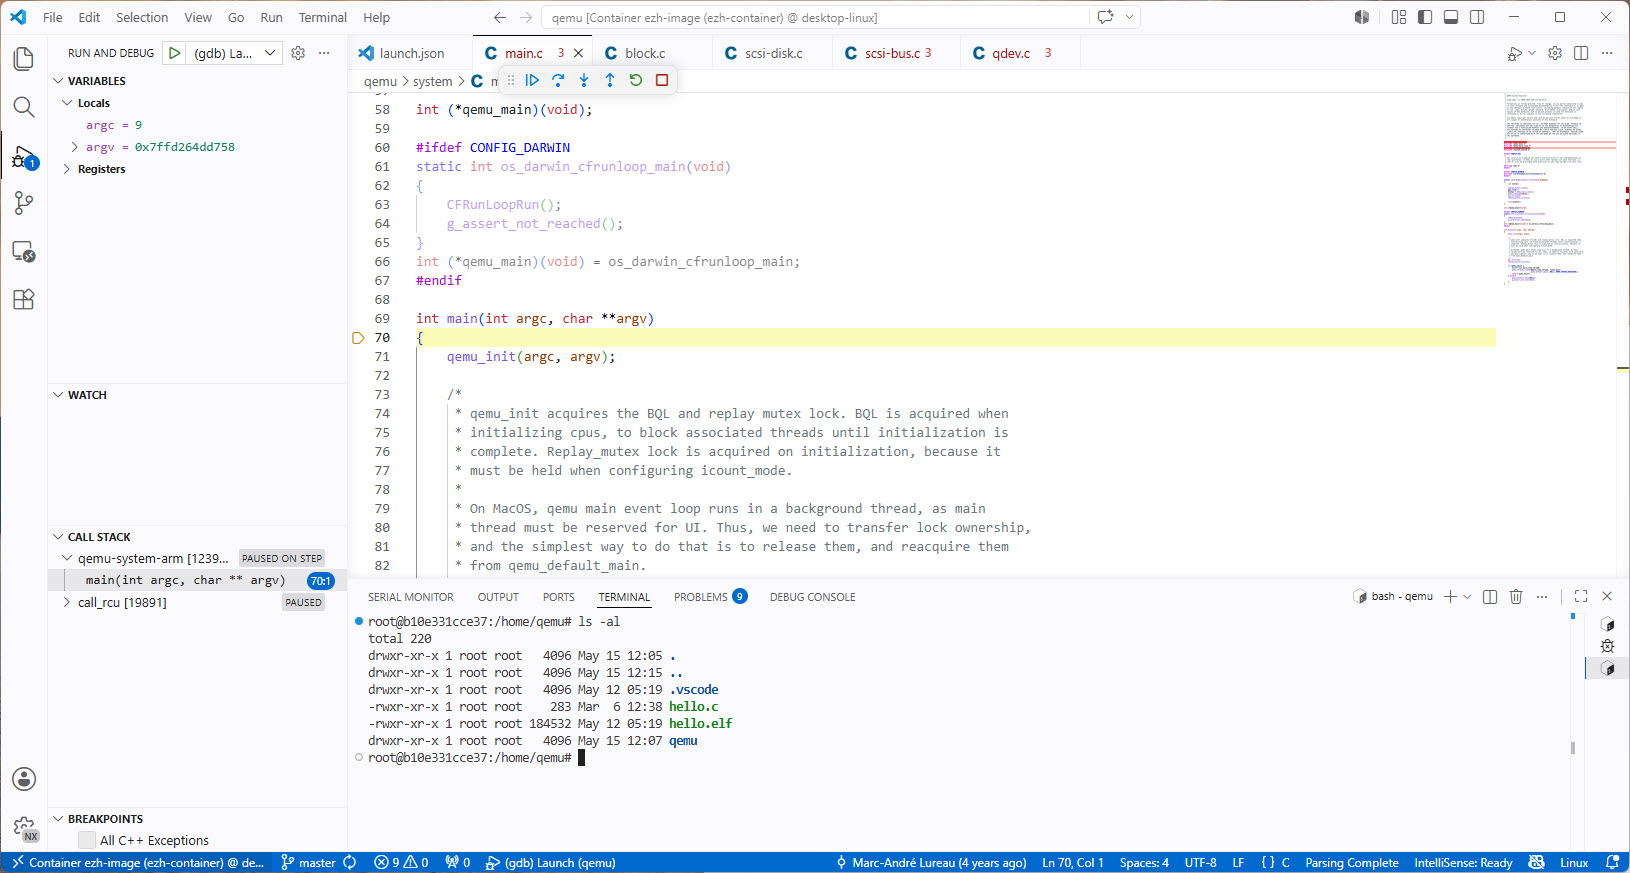
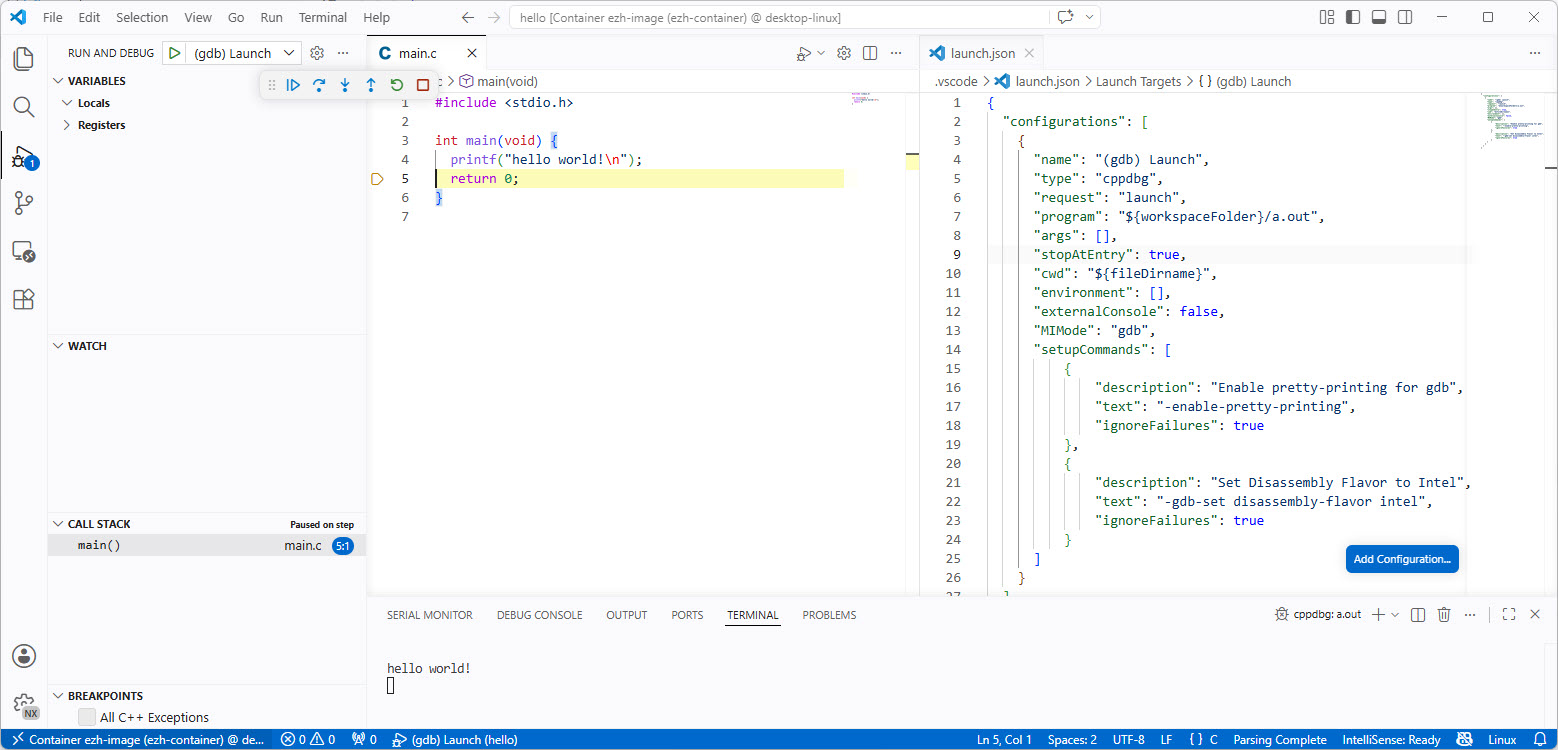
In this article, I show how to have the NXP MCUXpresso Installer installed in a DevContainer so it can be used with VS Code.
At the same time, I’m using the cortex-debug extension for other ARM Cortex-M based MCUs, for example the Raspberry Pi Pico series.
Does it makes sense to use cortex-debug for NXP devices, and what would be the benefit? More precise: can I use the NXP MCU-Link (LinkServer based) debug probes with cortex-debug, to debug another NXP MCU?
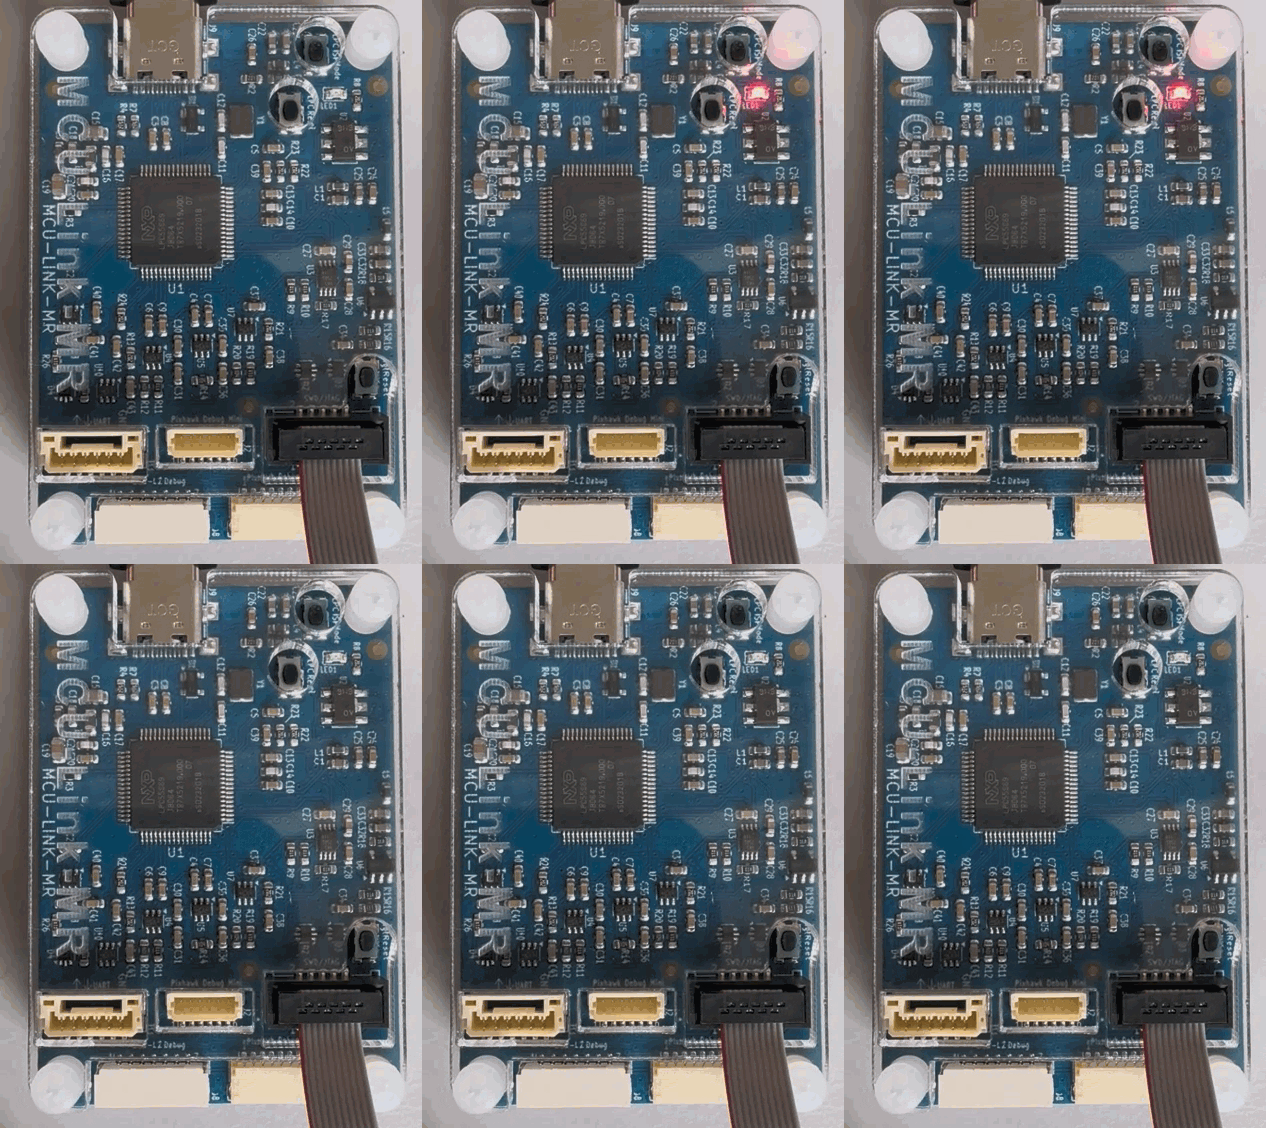
NXP MCU-Link (right) debugging a NXP MCU-Link Pro (LPC55S69, right)Continue reading →
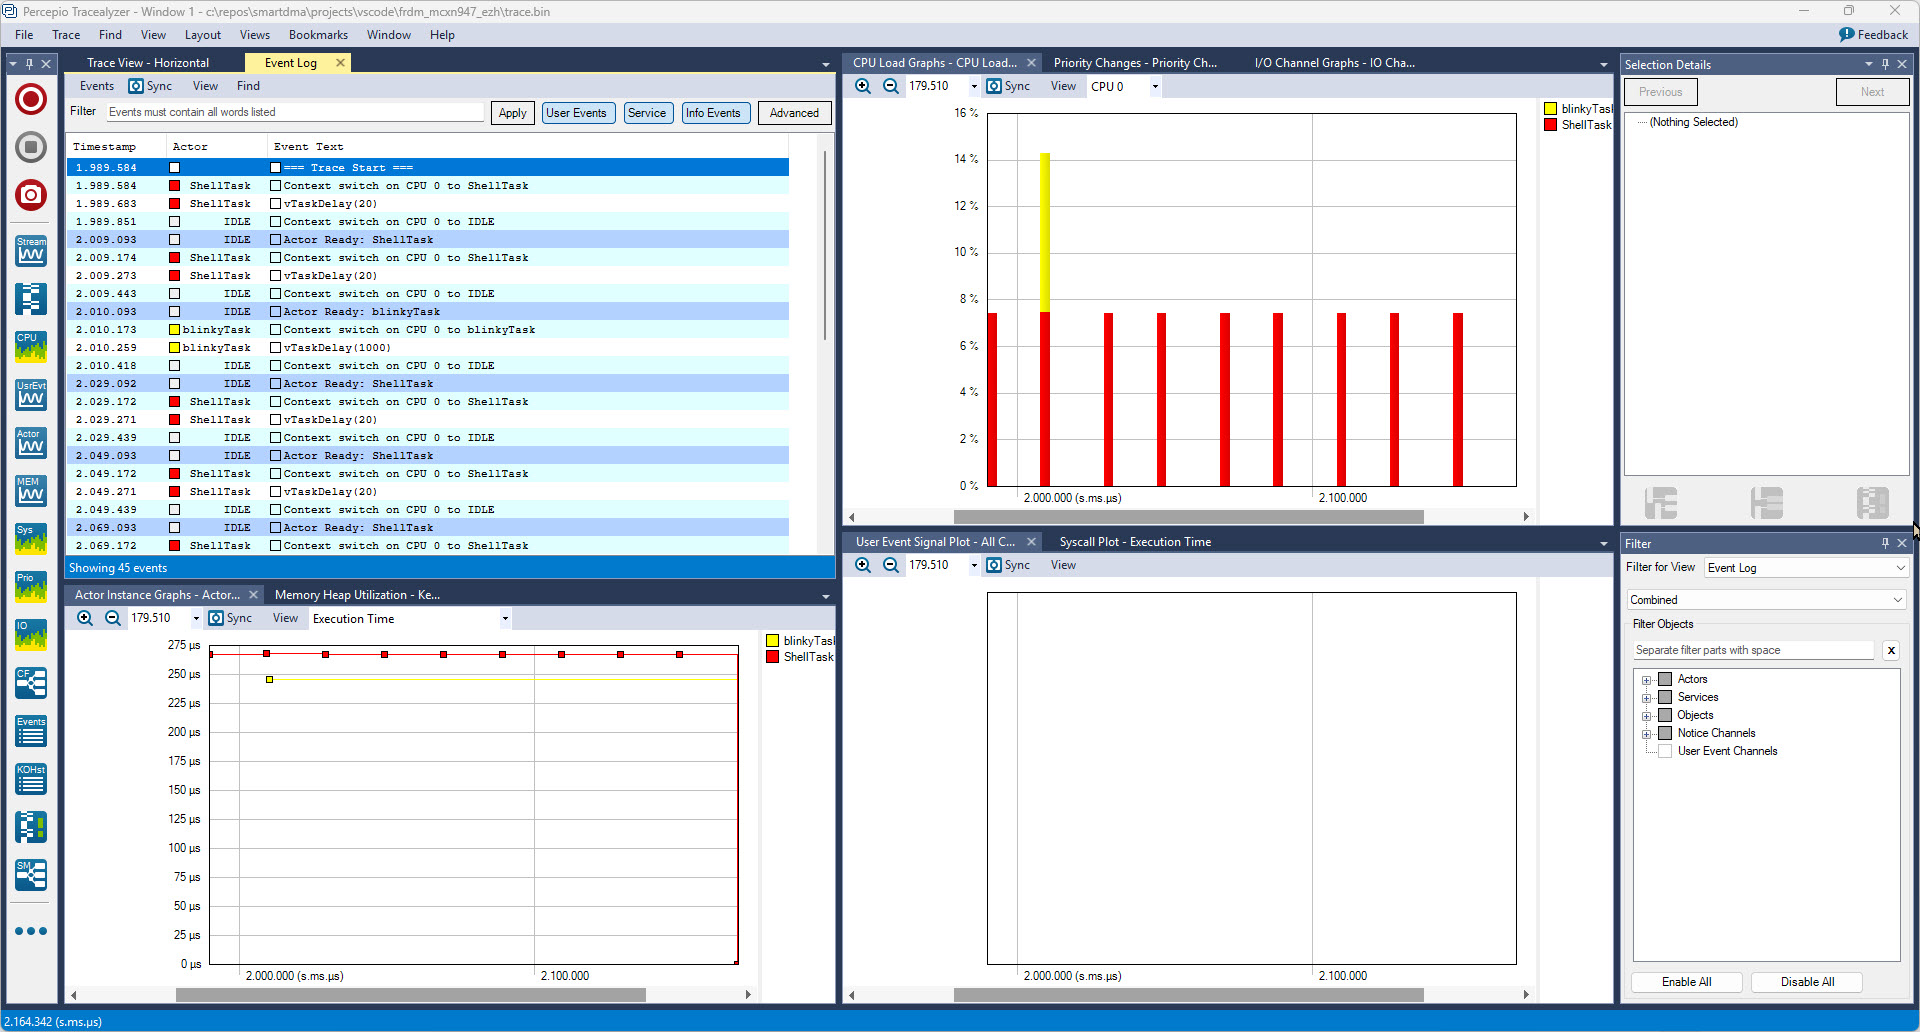
In my latest research project I’m using the NXP FRDM-MCXN947 board. As part of that project I have to collect and export application trace data for later analysis. In that project I’m using the the Tracealyzer product from Percepio.
Trace Data in Percepio Tracealyzer
In this article I describe different ways to export trace data from the embedded target: using generic GDB commands or with an trace exporter in VS Code.
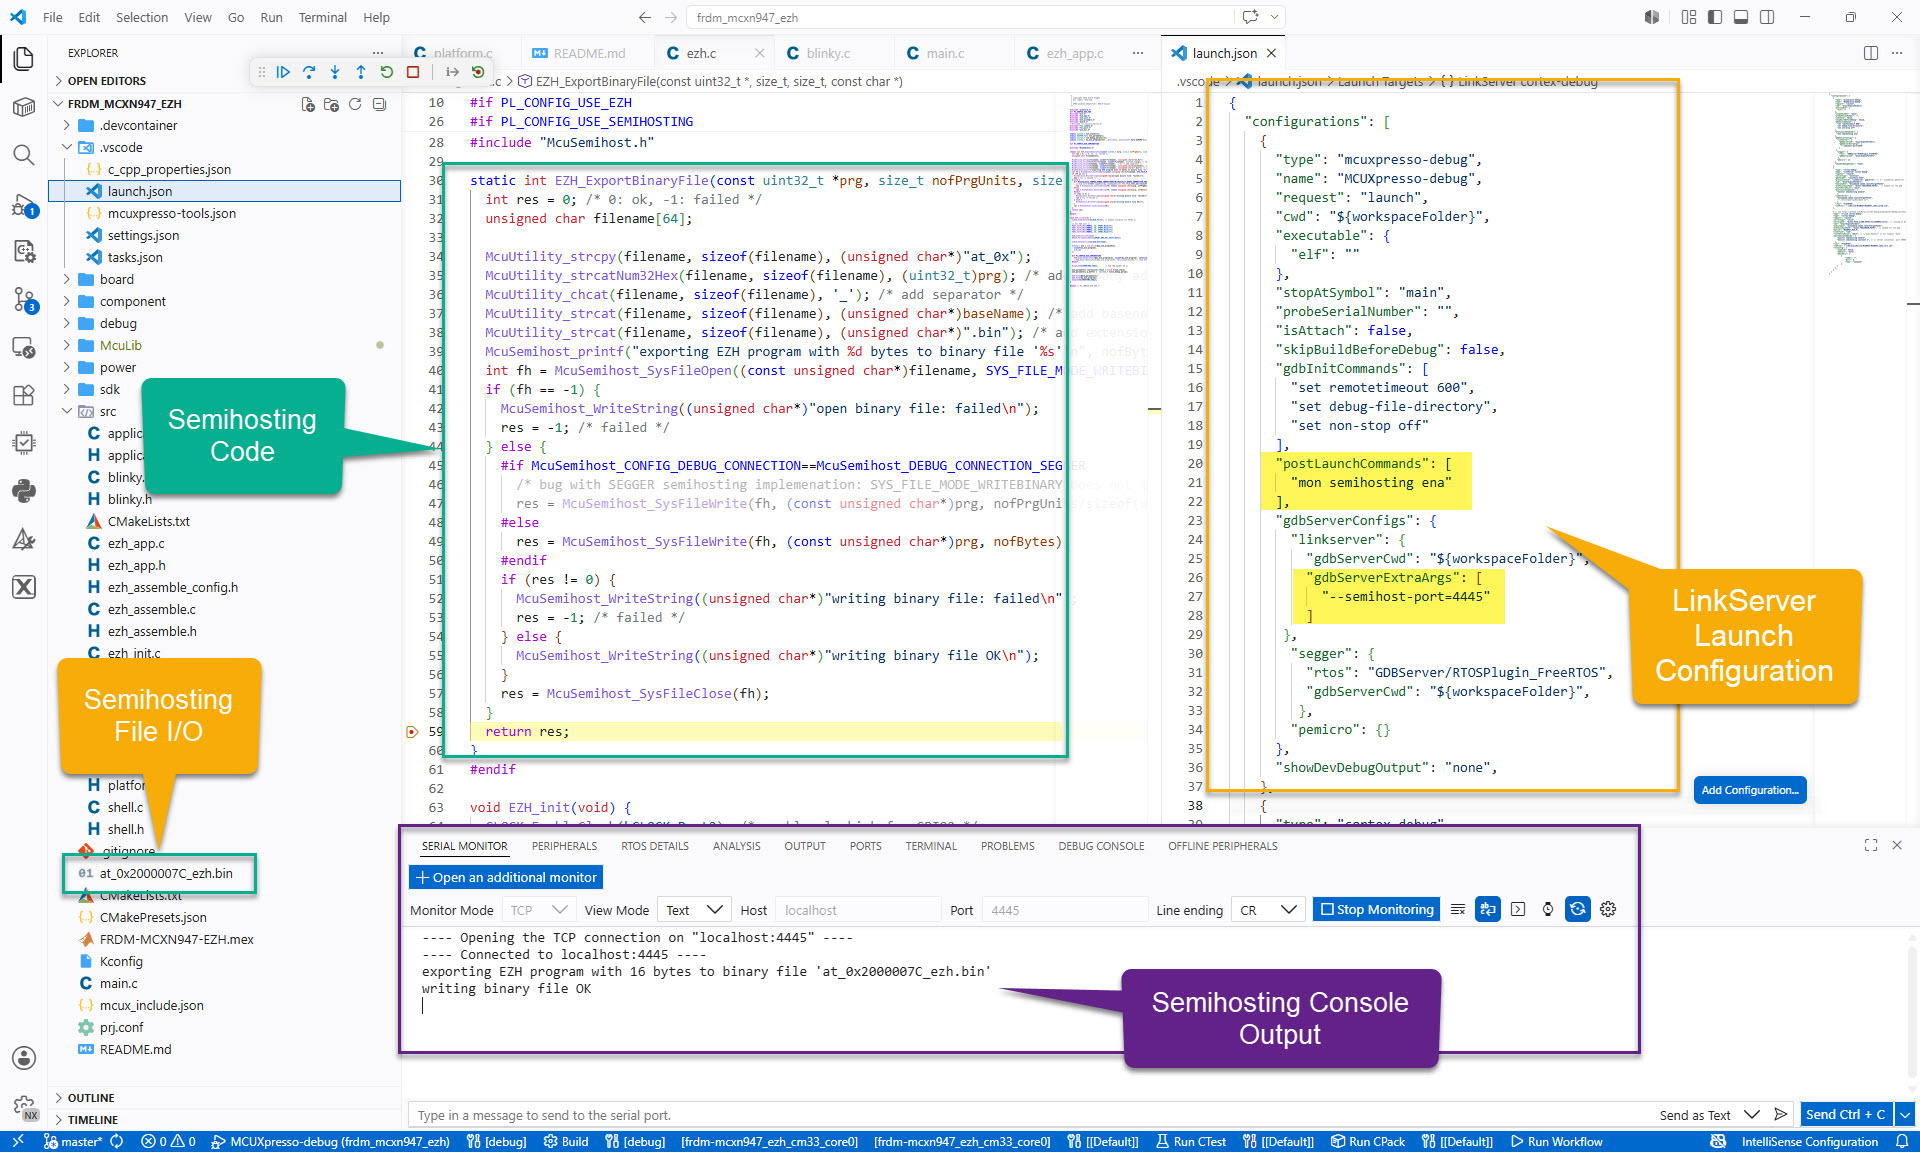
For an university research project, I need to write some console output and the same time write a file with data from the embedded board to the host. A logical choice for this is using semihosting.
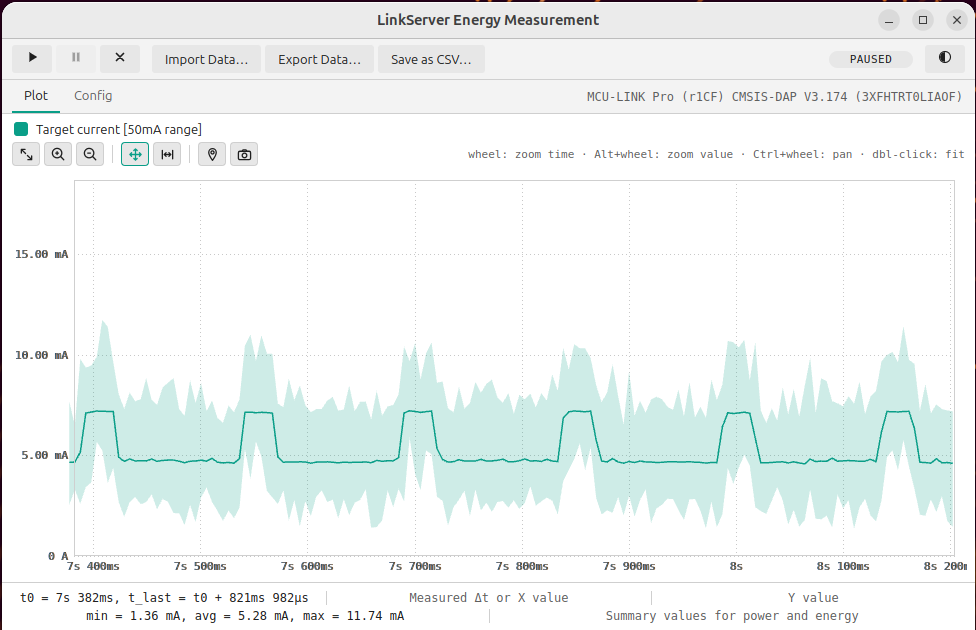
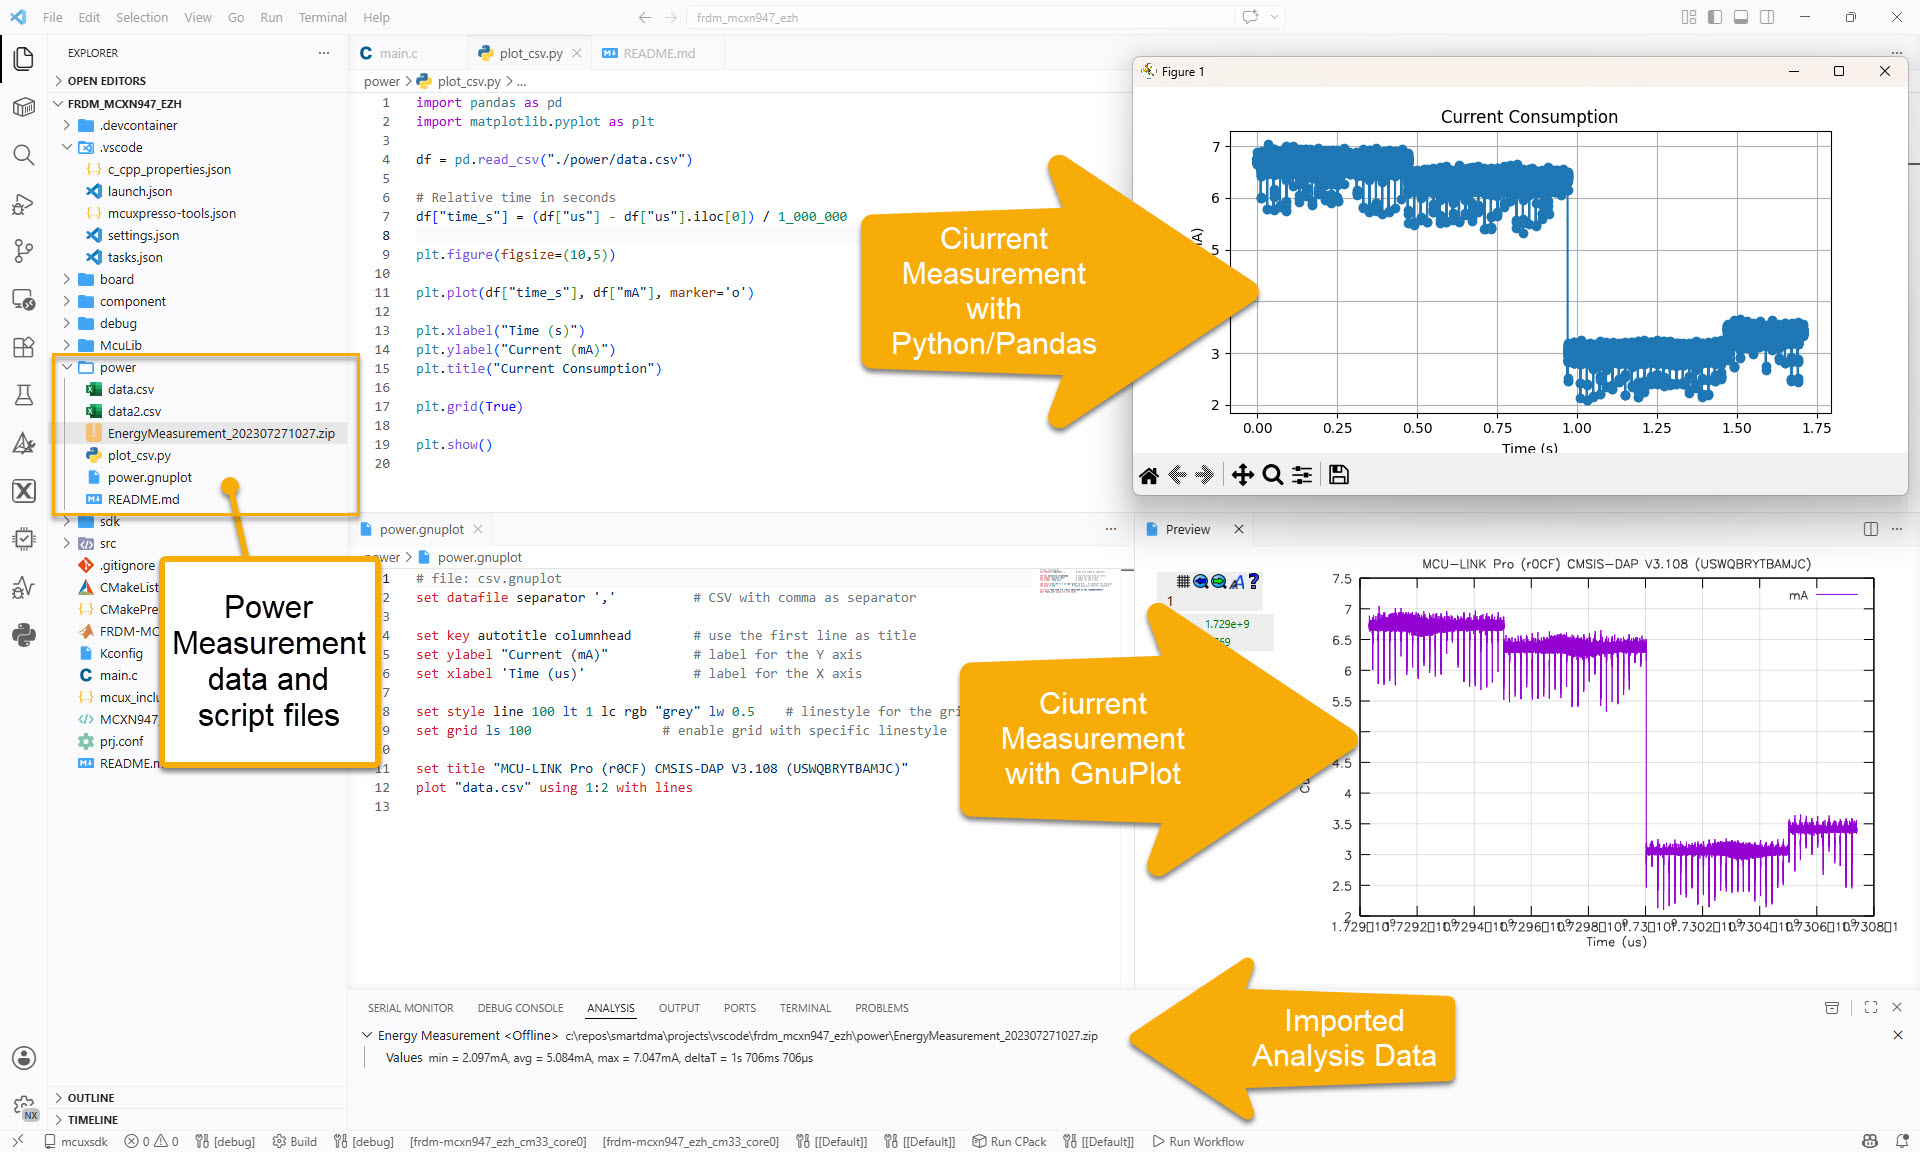
With the NXP MCU-Link Pro I can measure current and power/energy of an embedded target. In this article I describe how I can use and visualize that data in VS Code:
From my previous MetaClockClock project, I still had some hardware available. So I decided to build my largest build so far: to clocks with 78 clocks each.