With the NXP MCU-Link Pro I can measure current and power/energy of an embedded target. In this article I describe how I can use and visualize that data in VS Code:

With the NXP MCU-Link Pro I can measure current and power/energy of an embedded target. In this article I describe how I can use and visualize that data in VS Code:
The 3D Printed Rugged Enclosure for NXP MCU-Link Debug Probe has been very useful. I wanted to design something similar for the ‘MCU-Link Pro‘ version of that debug probe. There there is already a laser-cut enclosure for the probe itself. I used the same stack-able rugged box for the debug probe plus all the cables.
The MCU-Link debug probes are versatile and very useful debug probes from NXP. This article describes how to update the firmware on it, both the ‘traditional’ way with using the ISP jumper, and the new way using a command line script without the need to use a jumper.

With “Adding RGBW Wings and Enclosure to a Debug Probe” I have a really shiny enclosure for the MCU-Link Pro Enclosure.
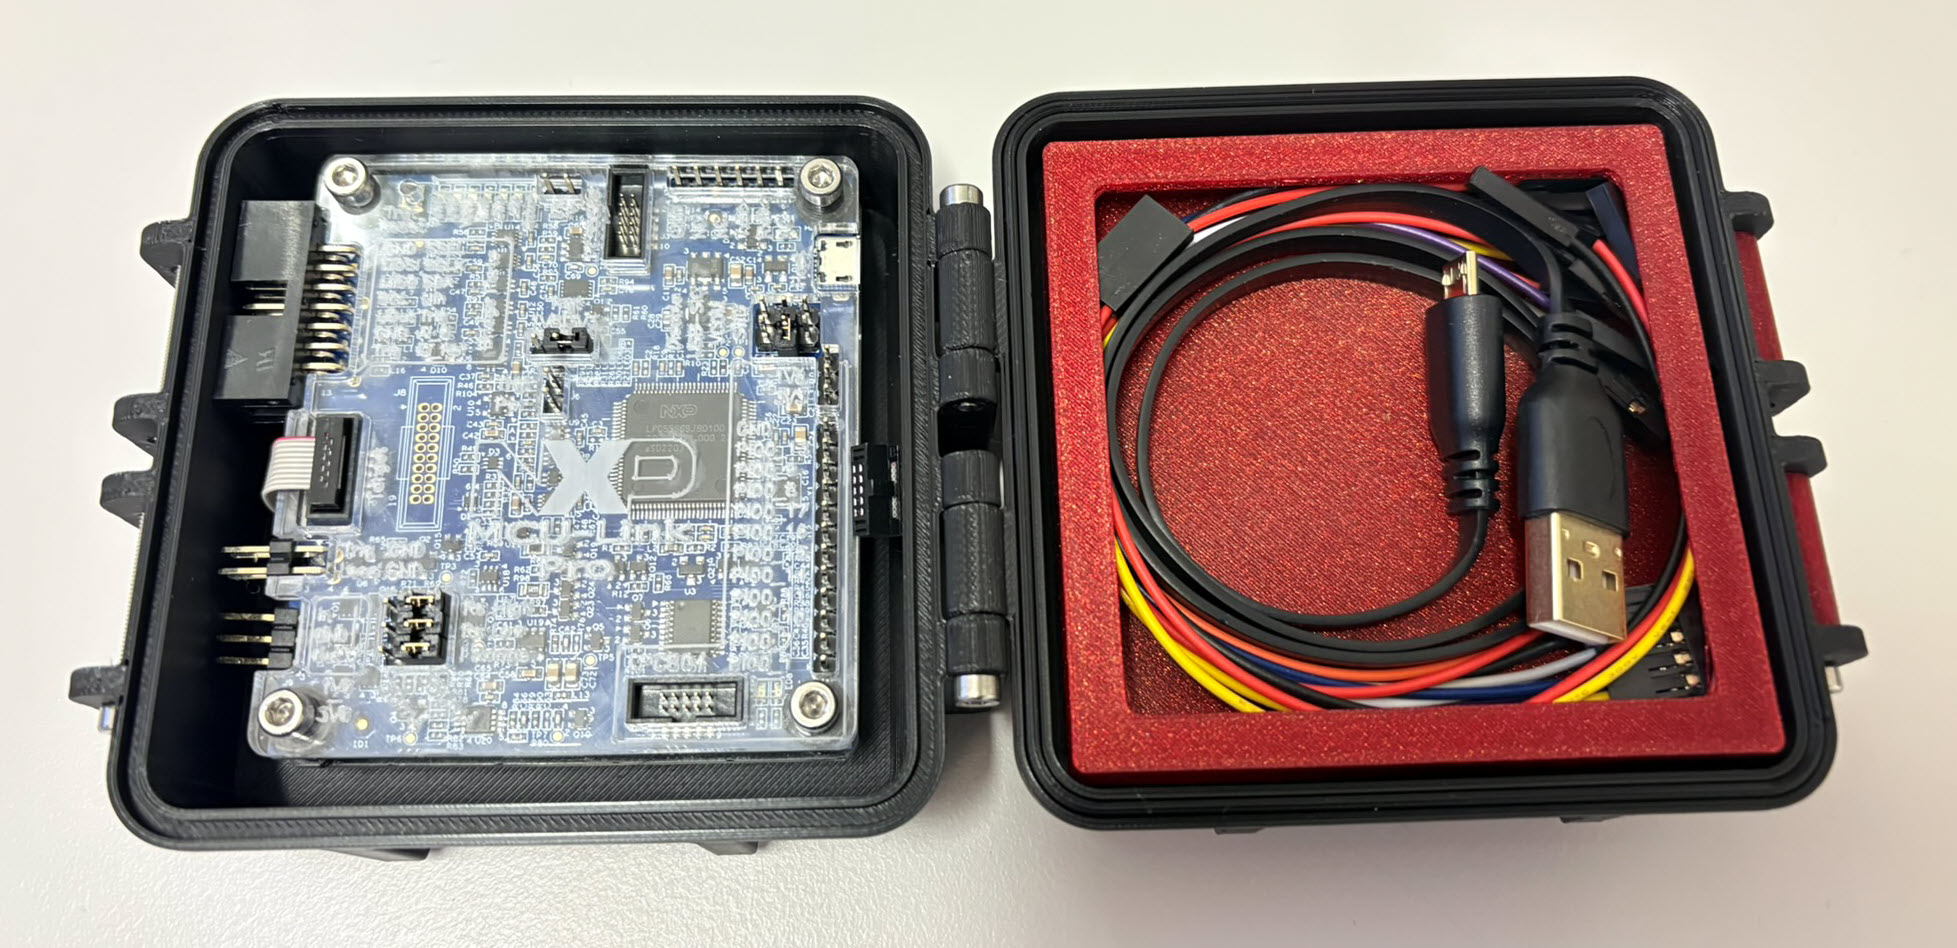
But I did not had enough time to replicate this for a full set of classroom hardware. The original card boxes from NXP showed already after one semester severe wear, so I have to setup something more robust: a box to store all the cables, and an enclosure to protect the PCB, for 40 units.
3D printing would take to much time, so I ended up with buying storage boxes and creating an laser-cut acrylic (PMMA) enclosure for the debug probe itself:
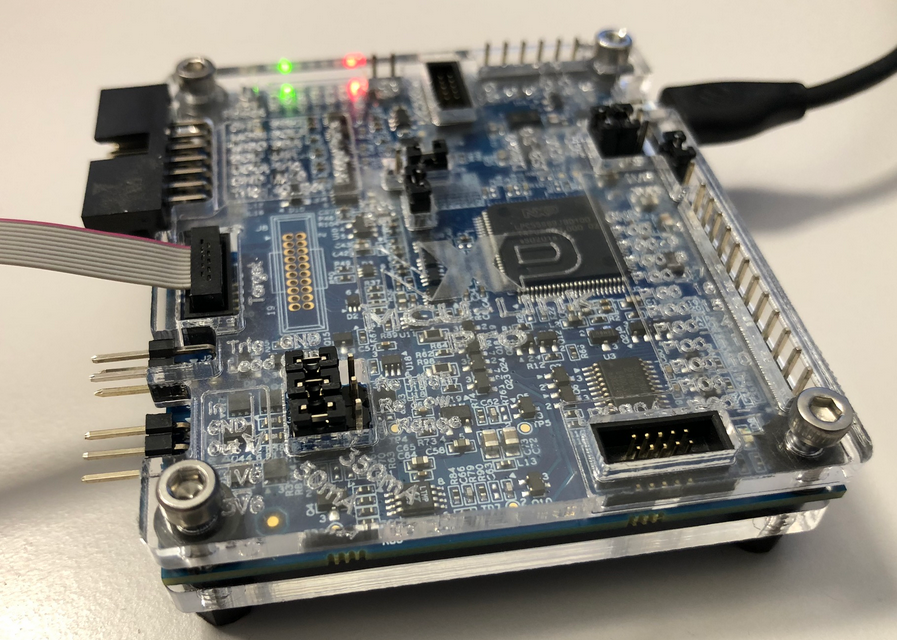
Dealing with and debugging distributed systems, I end up with multiple debug probes and target boards on my desk. When starting a debugging session, it can be hard to identify a debug probe by its serial number. What I do in such a situation: put a color stick on the debug probe and have it assigned a nickname.

That nickname then shows up during the debug connection, and I’m sure I connect to the right probe and board that way.
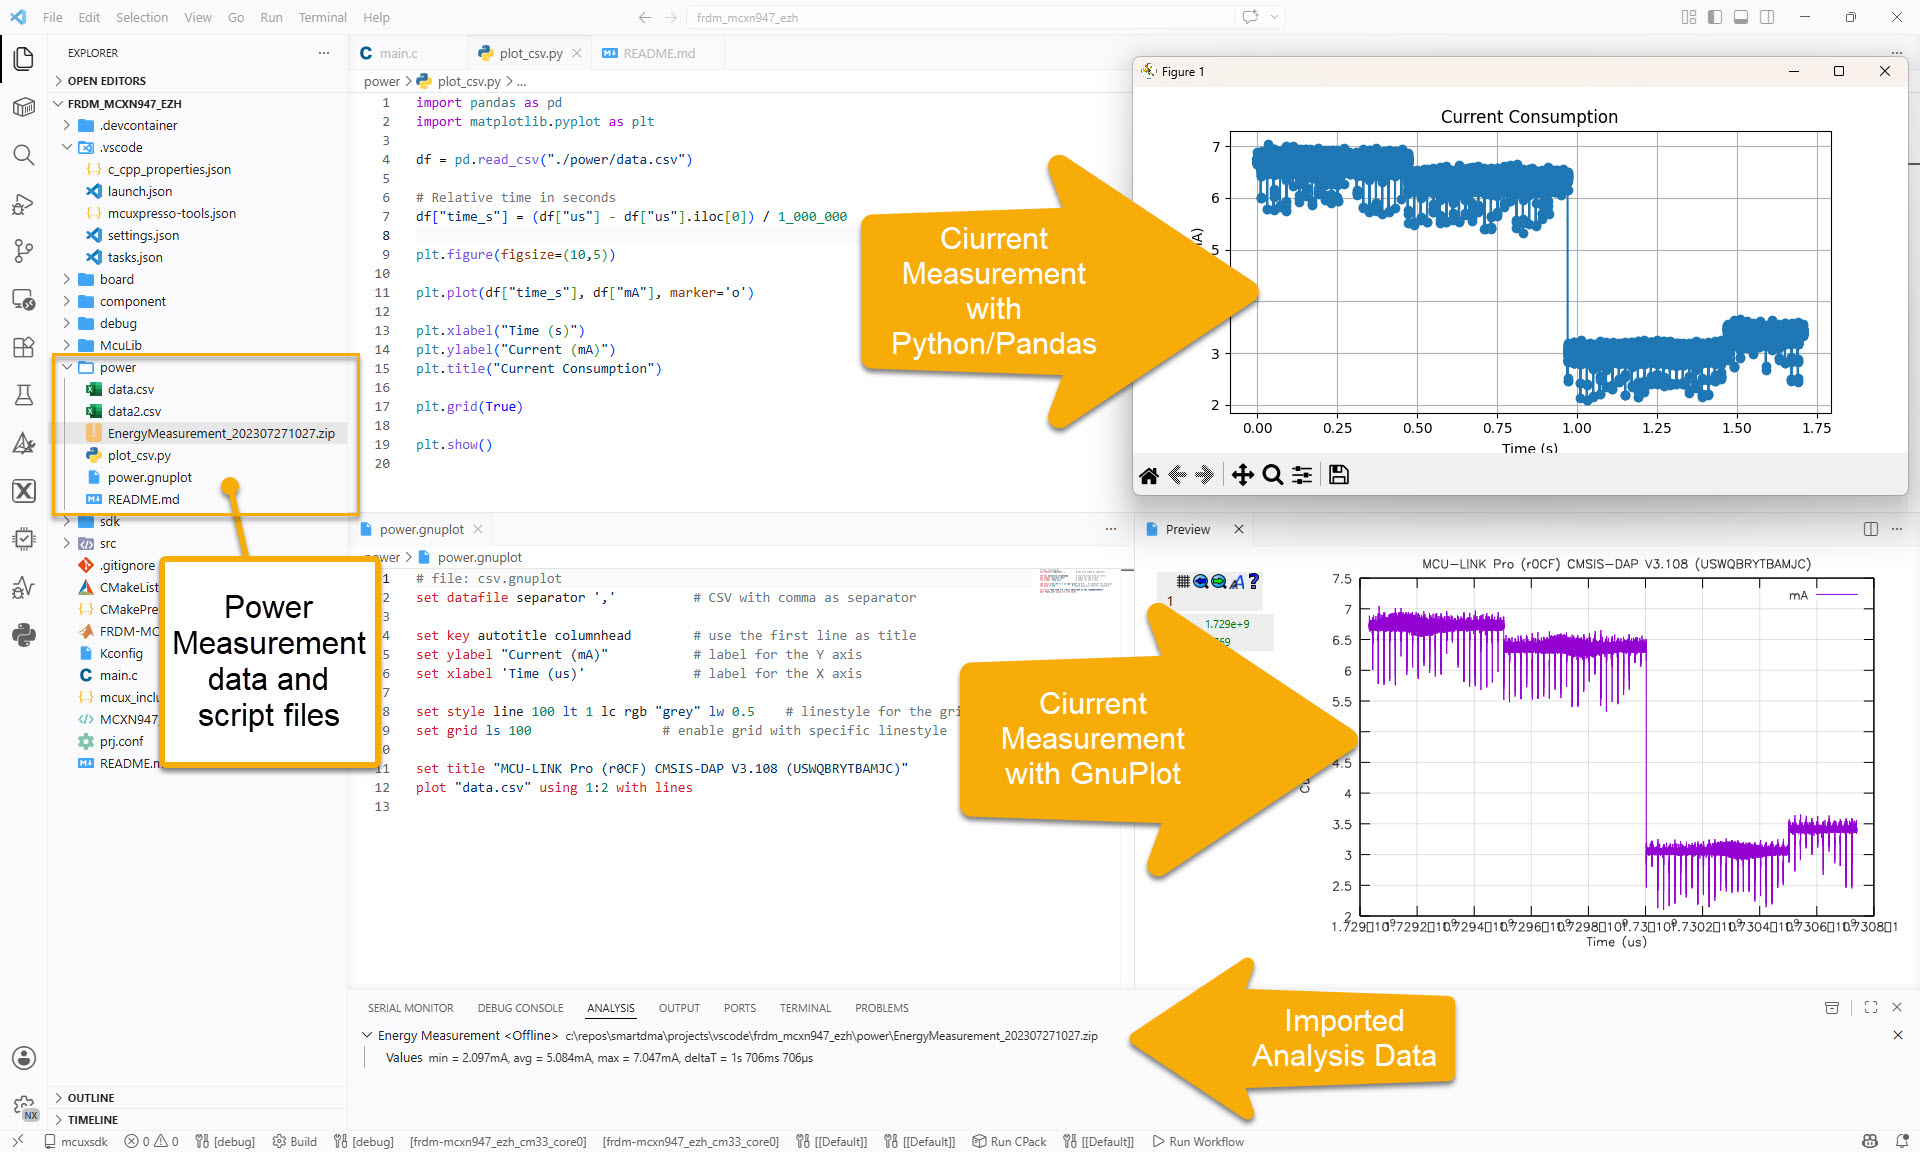
Continue readingThe combination of the NXP MCUXpresso IDE with the NXP MCU-Link Pro debug probe implements a nifty power and energy measurement tool (see New “MCU-Link Pro”: Debug Probe with Energy Measurement). The eclipse based IDE provides a dedicated view to inspect the data collected. It can export and import data, but it is in a binary format. In this article I present a way to export and then convert the data into .csv or any other format for processing or visualizing it in different ways.

Using an open source command line tool, the binary data gets converted into a csv format, which then can be consumed by many tools, e.g. gnuplot.
I’m using debug probes on a daily base. They have to be functional, and I value functionality over aesthetics. For cost reasons many debug probe vendors either only provide a bare PCB without enclosure, or the enclosure is made of simple plastic enclosure.
That’s OK. But when I received my NXP MCU-Link Pro debug probe, I wanted to add an enclosure for it: Not only to add protection,but to have it look cool too :-).
After the release of the NXP MCU-Link debug probe, there have been hints in the Eclipse based MCUXpresso IDE that there must be another one coming. And indeed: another and more powerful debug probe is now available: the MCU-Link Pro. It is not only a debug probe but a power/energy measurement tool too, including an extra LPC804 mikrocontroller which can be used for all kind of things, like automation or scripting.

