
Debugging a C/C++ application inside a Docker Container using VS Code is surprisingly easy.

This article shows the needed steps.
Outline
With Docker containers, I can isolate my development environment. It works very well for host and embedded application development.
A few weeks ago I published an article about how to debug a Linux application on an embedded board with VS Code (see “Debugging Linux Apps with VS Code: A Step-by-Step Guide“). The question I have received a few days ago is “how to use VS Code to debug a C/C++ application in side a container?“.
So here is how to do this: creating a simple ‘hello world’ application inside the container and then debug it with VS Code.
Prerequisites
I assume that you have docker (https://www.docker.com/) and VS code installed (https://code.visualstudio.com/). Plus that you have the docker image built and the container running. Otherwise you might have a read at “CI/CD for Embedded with VS Code, Docker and GitHub Actions“.
In VS Code, I have the following extensions installed:
- C/C++ (ms-vscode.cpptools)
- C/C++ DevTools (ms-vscode.cpp-devtools)
- Remote Development (ms-vscode-remote.vscode-remote-extensionpack)
- Container Tools (ms-azuretools.vscode-containers)
Hello World
In a first step, let’s create a simple hello world.
Log into your container. Then create a directory for the project:
$ mkdir hello
$ cd hello
Create a file main.c with following content:
#include <stdio.h>

int main(void) {
  printf("hello world!\n");
  return 0;
}
Compile it with debug information.
$ gcc main.c -ggdb
This creates the a.out we want to debug.
Next we are going to prepare a launch configuration for VS Code.
VS Code Launch Configuration
Next, we create a VS Code launch configuration.
Create the .vscode directory inside the project folder:
$ mkdir .vscode
Inside that folder, create a file launch.json with the following content:
{
  "configurations": [
    {
      "name": "(gdb) Launch",
      "type": "cppdbg",
      "request": "launch",
      "program": "${workspaceFolder}/a.out",
      "args": [],
      "stopAtEntry": true,
      "cwd": "${fileDirname}",
      "environment": [],
      "externalConsole": false,
      "MIMode": "gdb",
      "setupCommands": [
          {
              "description": "Enable pretty-printing for gdb",
              "text": "-enable-pretty-printing",
              "ignoreFailures": true
          },
          {
              "description": "Set Disassembly Flavor to Intel",
              "text": "-gdb-set disassembly-flavor intel",
              "ignoreFailures": true
          }
      ]
    }
  ]
}
Next we are going to attach to the running container.
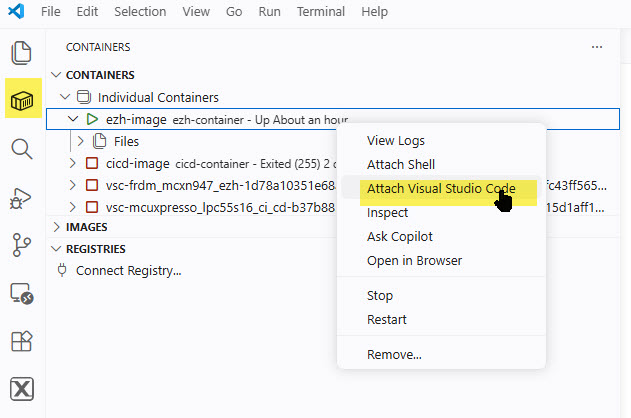
Attach to Container
The next step is to attach VS Code to the running container. If it is not running, start it first.
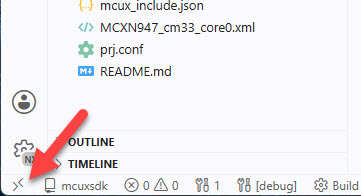
An alternative way is to click on the >< (Open Remote Window) in the left lower corner:
And then use ‘attach to running container’:
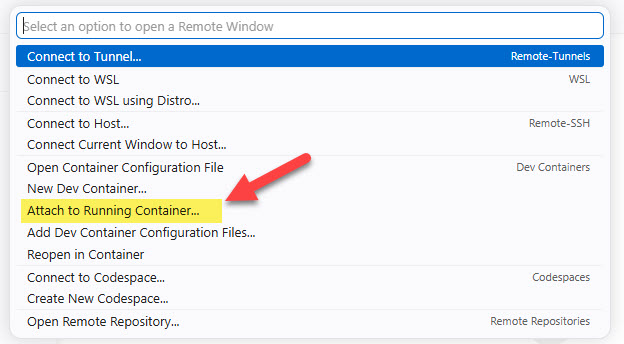
This opens a new VS Code window. Then use the menu File -> Open Folder to go to the project we have created earlier.
Next, we need to ensure with have the right extension installed with the container.
C/C++ extensions
Go to the extension settings and make sure the C/C++ extension are installed for the container:
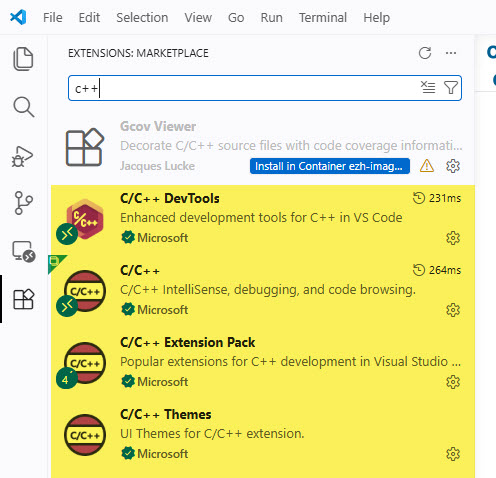
Next, we are going to debug the application.
Debug
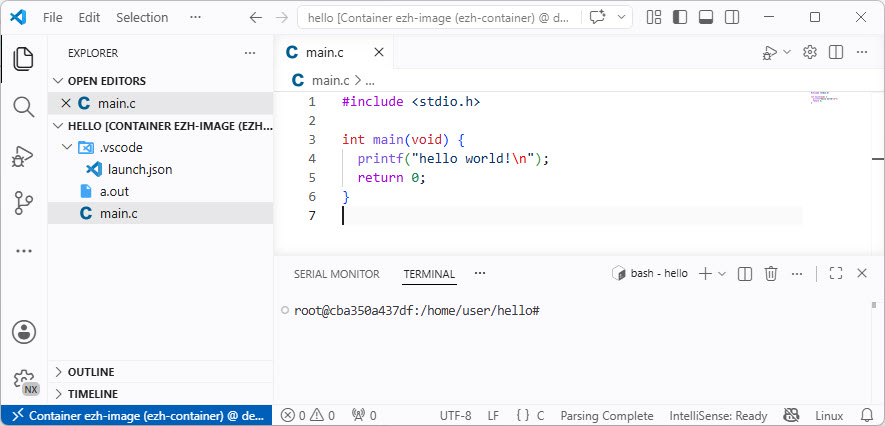
Finally, we can debug the application. Use the normal ‘debug’ with the launch configuration we have created:
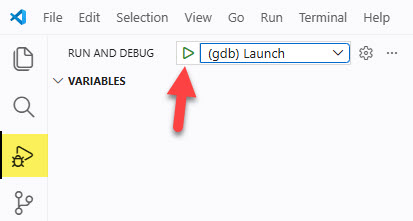
Congratulations: you are debugging the application with VS Code in the container:
Summary
Debugging a C/C++ with VS Code inside a Docker container is not complex. I need a launch configuration, the C/C++ extensions and then I can attach to the running container with VS Code. From there I can debug the application in the container as it would be on my local host.
Happy debugging 🙂
