With the NXP MCU-Link Pro I can measure current and power/energy of an embedded target. In this article I describe how I can use and visualize that data in VS Code:

With the NXP MCU-Link Pro I can measure current and power/energy of an embedded target. In this article I describe how I can use and visualize that data in VS Code:
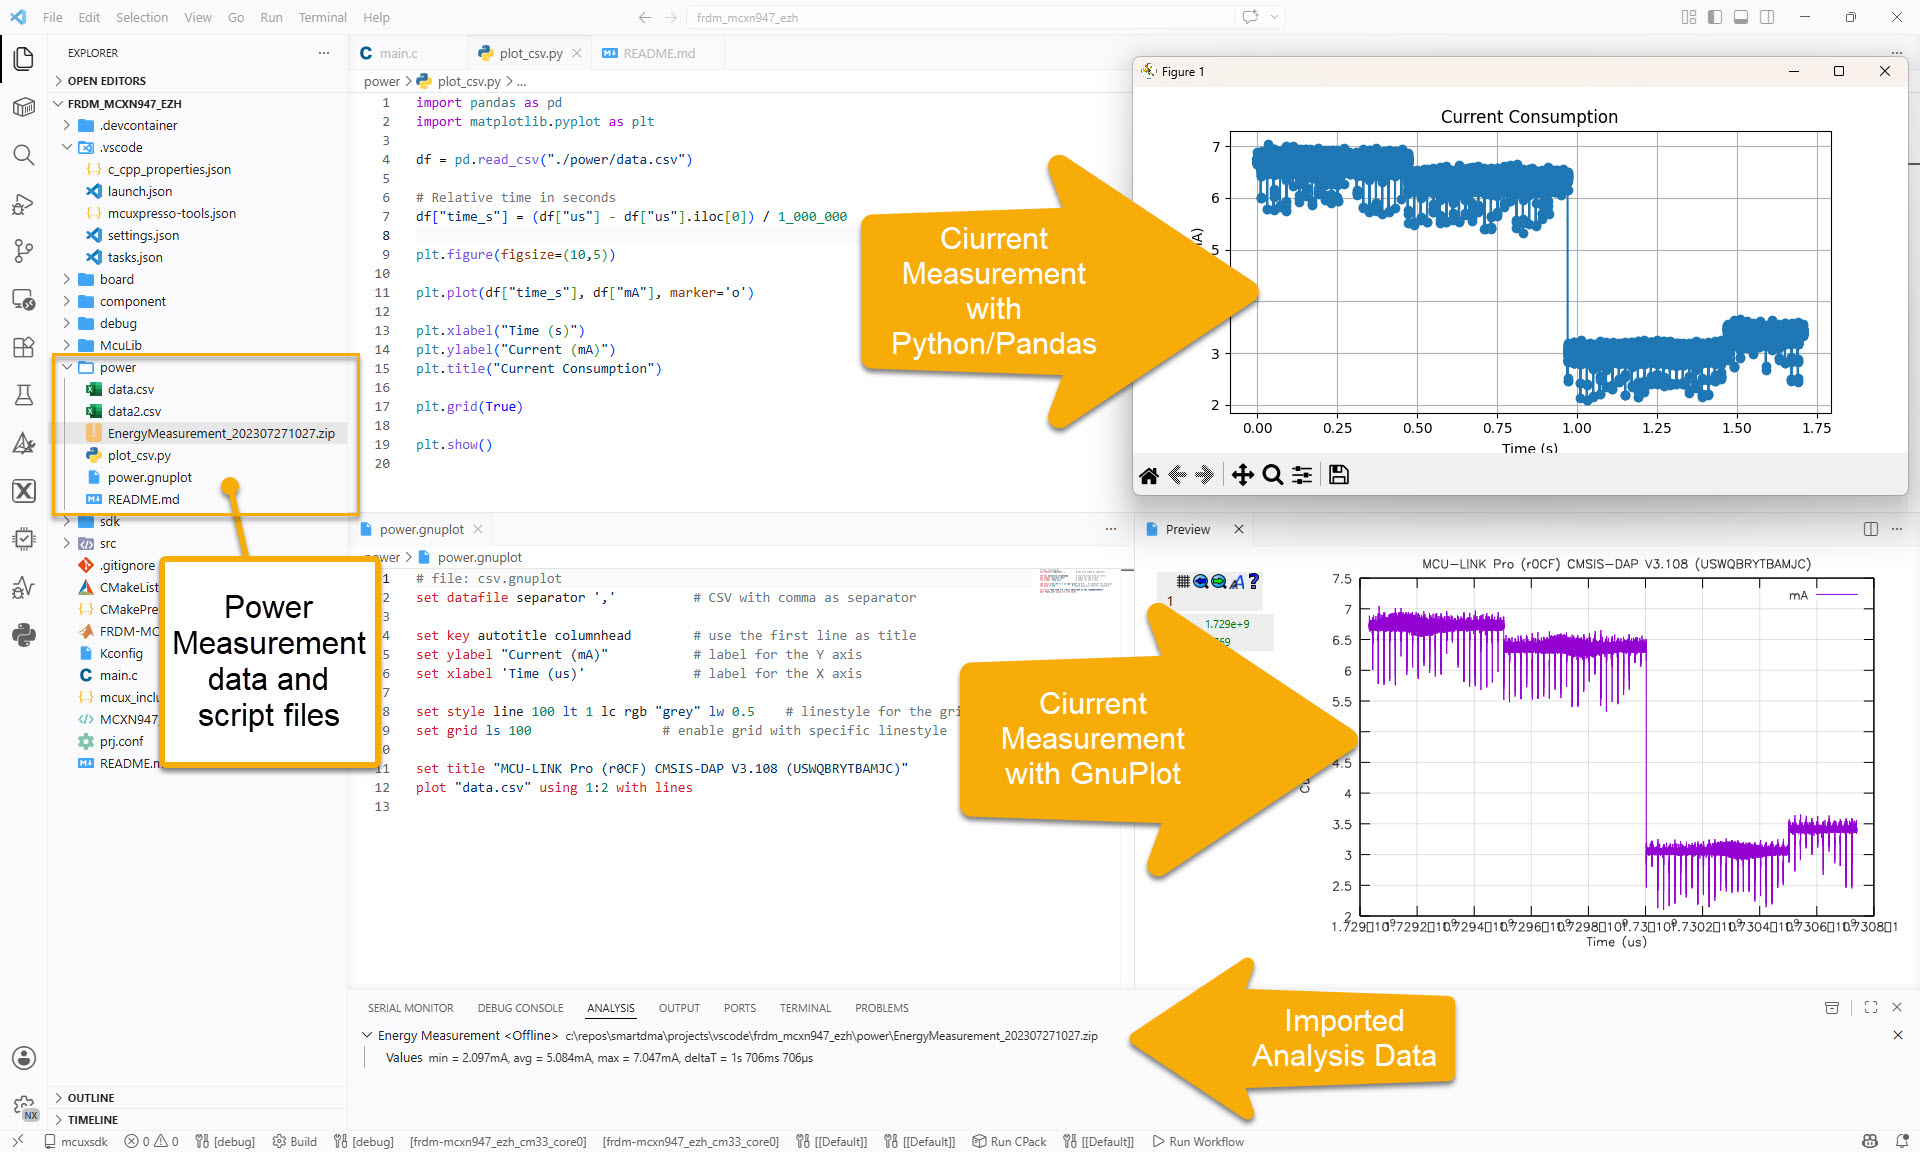
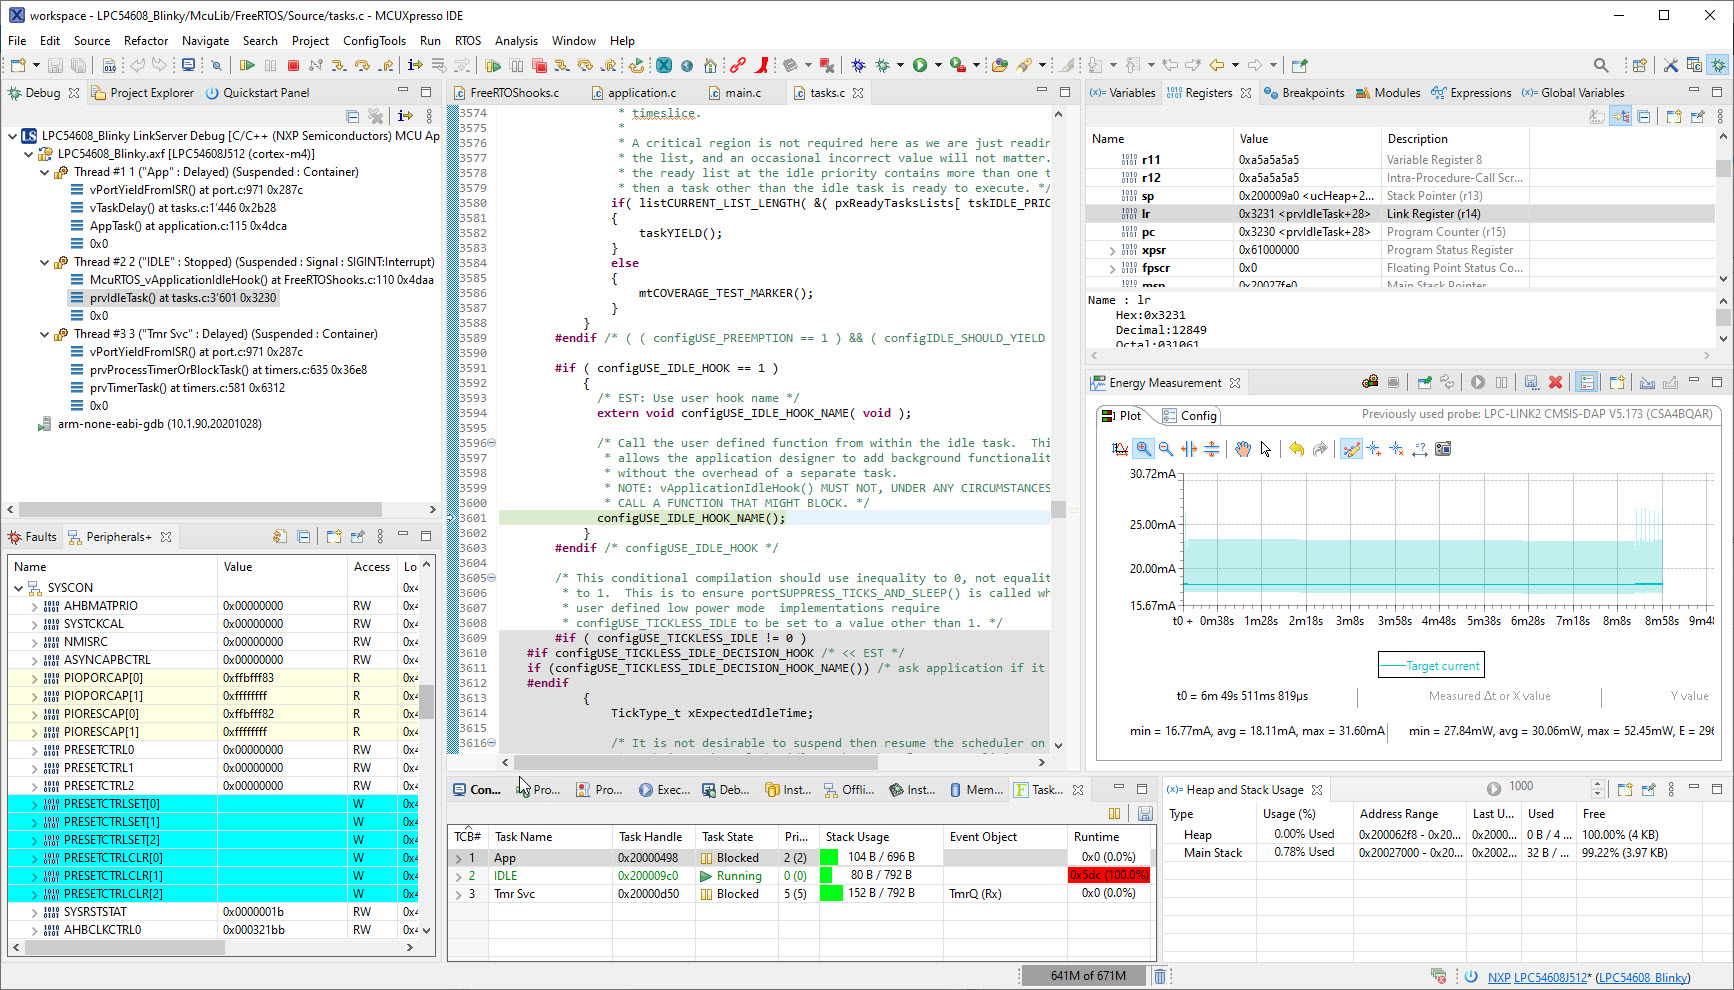
The combination of the NXP MCUXpresso IDE with the NXP MCU-Link Pro debug probe implements a nifty power and energy measurement tool (see New “MCU-Link Pro”: Debug Probe with Energy Measurement). The eclipse based IDE provides a dedicated view to inspect the data collected. It can export and import data, but it is in a binary format. In this article I present a way to export and then convert the data into .csv or any other format for processing or visualizing it in different ways.

Using an open source command line tool, the binary data gets converted into a csv format, which then can be consumed by many tools, e.g. gnuplot.
University exam grading are all done now and results are in the system, and it is already time to prepare for the fall semester. I always try to use the latest and greatest tools in my courses, and the NXP MCUXpresso IDE 11.4.0 just came out. So time to have a look and explore the changes and features.
Implementing low power in embedded applications implemented can be challenging. Measuring current consumption is a first step to see if the software changes indeed have an effect on the current consumed. The PEmicro Universal Multilink FX debug probe comes with a useful feature to provide power to the target and the same time to measure the current consumption and to show the current used in the Eclipse IDE:
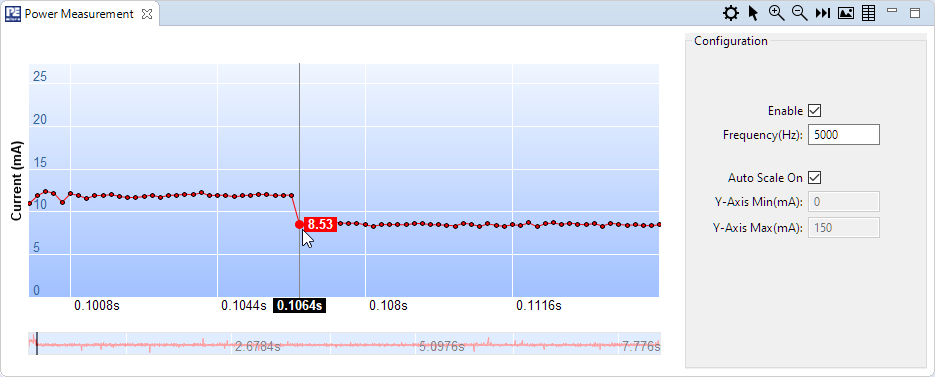
PEmicro power measurement
