
Implementing low power in embedded applications implemented can be challenging. Measuring current consumption is a first step to see if the software changes indeed have an effect on the current consumed. The PEmicro Universal Multilink FX debug probe comes with a useful feature to provide power to the target and the same time to measure the current consumption and to show the current used in the Eclipse IDE:
PEmicro power measurement
The power measurement is part of the P&E (PEmicro) Eclipse plugins and is for example included in the NXP MCUXpresso IDE. It can be installed in any Eclipse CDT.
The ‘Power Measurement’ view can be shown using the usual ‘view’ menu:
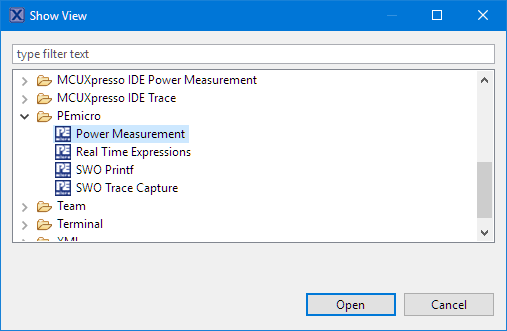
PEMicro Power Measurement
The power measurement feature is not part of the ‘standard Universal’ but the ‘FX’ product line. I’m using a Rev C of the P&E Multilink Universal FX with the NXP MCUXpresso IDE v11.2.1:

P&E Multilink Universal FX Rev C
💡 Multilink Universal FX Rev C and later is required for the power measurement feature, see http://www.pemicro.com/blog/index.cfm?post_id=165
The debug probe is able to directly power a target through the debug connector:

FRDM-K64F Powered by P&E Multilink Universal FX Rev C
Power is injected using the Vcc Sense pin 1 of the SWD Debug Header:
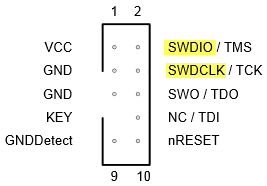
SWD 10pin Connector
Power selection (none (jumper removed), 3.3V and 5V) is configured with a jumper inside the probe:
💡 be careful providing 5V to a 3.3V target as this could damage the device if it is not able to deal with 5V input!
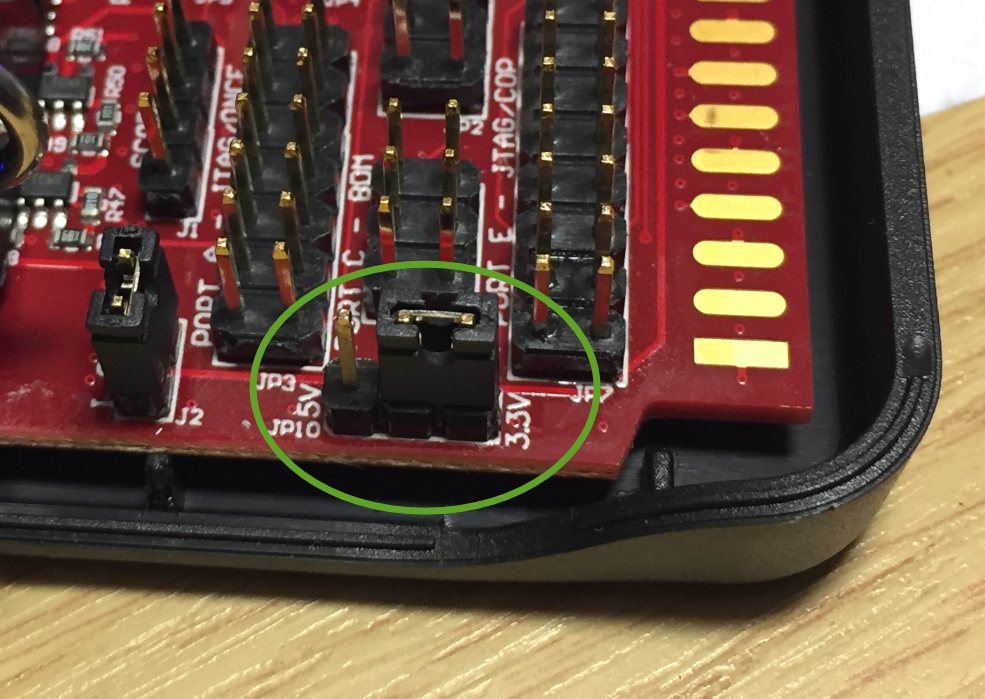
Power Selection jumper J10
The FX is able to provide up to 200 mA to the target which is plenty for most boards.
The P&E Eclipse Launch configuration dialog has a setting to control the power:
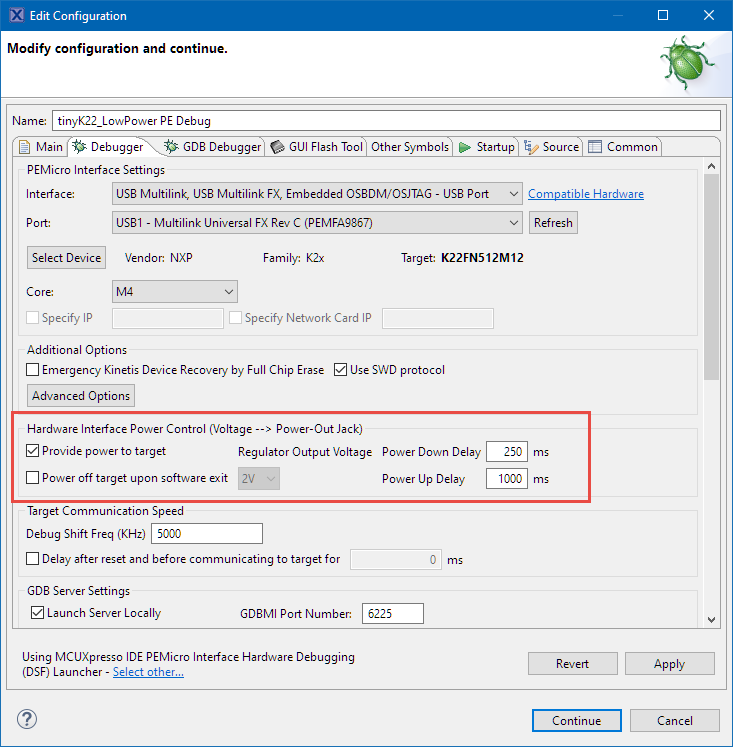
Hardware Interface Power Control
The settings do not seem to control the power provided by the Rev C Multilink I have, probably because it does not have the needed extra circuit. The do work nicely with the PEmicro Cyclone I have in my arsenal :-).
In PEmicro Power Measurement view, I can enable power measurement using the gear icon:
Power Measurement Gear Icon
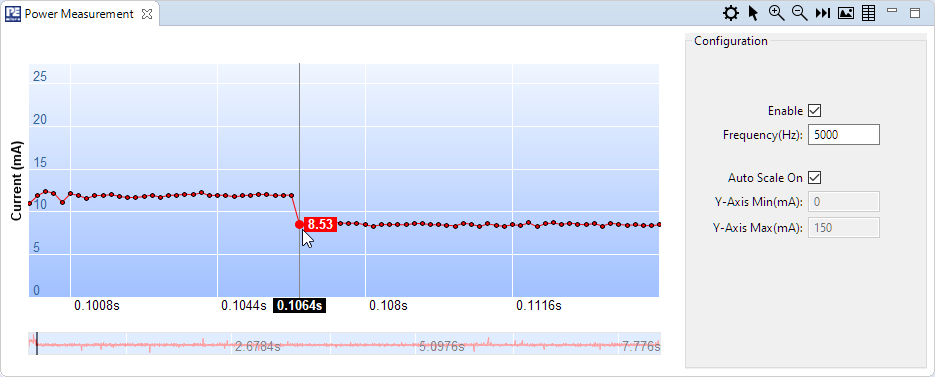
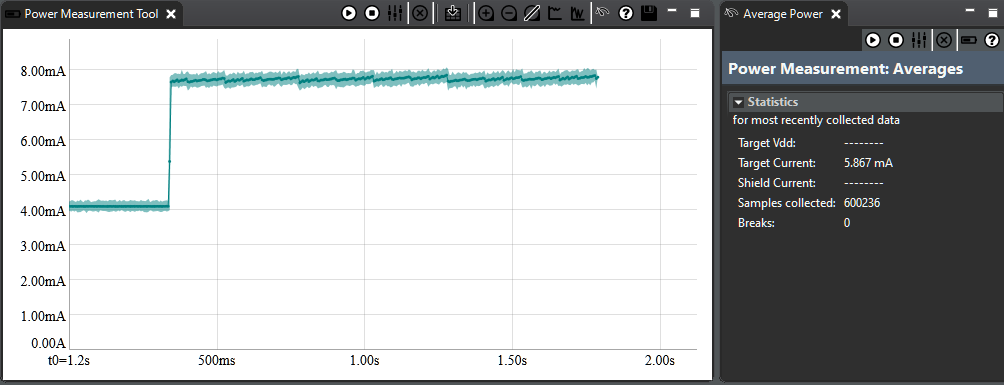
With this, I can easily monitor the board power consumption over time. Below a board drawing plenty of power and turning off parts of the board to save energy:
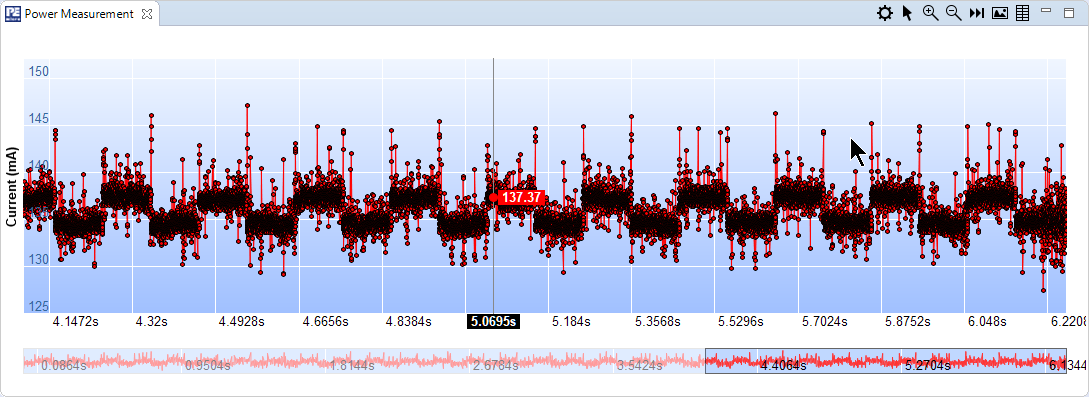
Power Measurement
The user interface is very intuitive and I can use the mouse to drag and zoom. The view/data is nicely synchronized with the debug session: it collects data while running and stops when I halt the target. I can step through the code and it keeps up with that too.
Data can be exported either as image (.png) or as .csv file. Having the in .csv allows me to filter and graph it in different ways. I can run different scenarios and compare the data that way too.
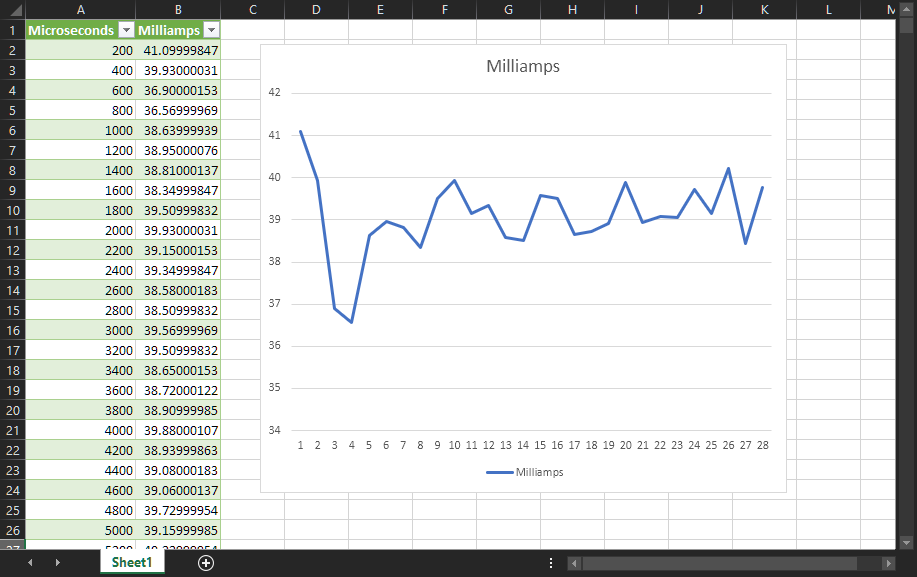
CSV Data
One thing to keep in mind is that the measurement is on a board level and through the debug connector: This gives a good overall view, but not much detail about individual components (e.g. MCU alone): for this I use dedicated measurement points.
The other thing is that it requires an active debug connection to the target: most MCUs have low power modes which are not enabled if there is an active debug connection or the debug block is cut off and then you cannot measure it with the method used here. So the P&E Power Measurement is for sure a useful thing, but does not replace the need for a good and highly dynamic power measurement probe, like the Qoitech Otii which I have on my bench:
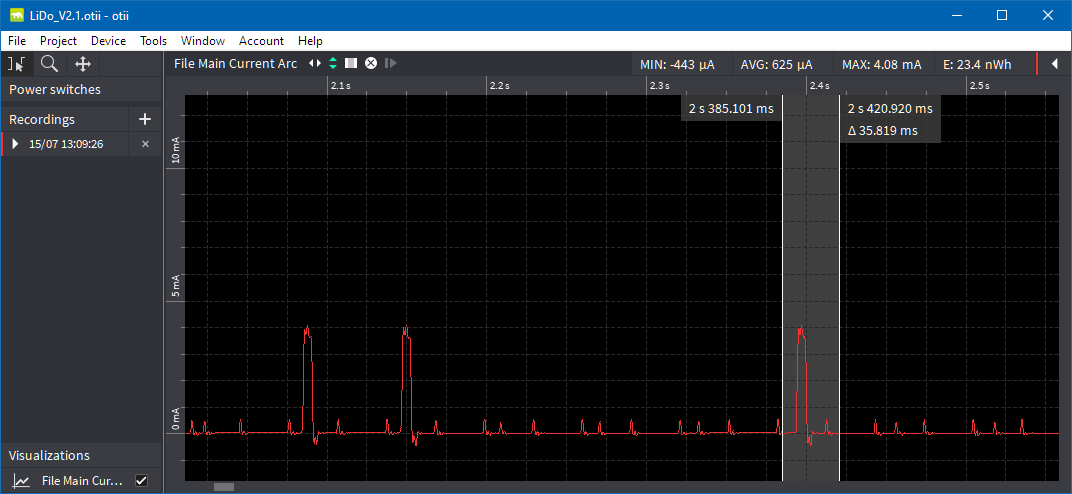
Otii Energy Measurement
Oh, and not to forget: there is already another Power Measurement Tool in the NXP MCUXpresso IDE:
MCUXpresso IDE Power Measurement Tool
Happy Powering 🙂
Links
- P&E Blog Post: https://www.pemicro.com/blog/index.cfm?post_id=165
- P&E Multilink Universal FX: http://www.pemicro.com/products/product_viewDetails.cfm?product_id=15320143&productTab=1
- MCUXpresso IDE 11.2.1: https://mcuoneclipse.com/2020/10/17/mcuxpresso-ide-v11-2-1/

Have you seen the Power Debugger from Atmel (ups!) Microchip?
https://www.microchip.com/DevelopmentTools/ProductDetails/ATPOWERDEBUGGER
LikeLike
Yes, have seen that one from Atmel/Microchip, but never had the opportunity to use it. There is as well the STM32 Power shield: https://www.st.com/en/evaluation-tools/x-nucleo-lpm01a.html
LikeLike