If a Cortex microcontroller is unresponsive to a debug connection for various reasons, then this trick might help to recover that device for you. All you need is a debug probe from PEMICRO and a utility.


If a Cortex microcontroller is unresponsive to a debug connection for various reasons, then this trick might help to recover that device for you. All you need is a debug probe from PEMICRO and a utility.
The NXP MCU-Link is a powerful $10 debug probe for ARM Cortex-M devices and works with the NXP LinkServer for debugging. The LinkServer does not an implement a gdb server, so it limits its usage e.g. for scripting or command line debugging. But as MCU-Link is also a CMSIS-DAP compatible debug probe, I can use it with OpenOCD which is open source and implements a GDB server. This article shows how I can use it with the MCU-Link.

Debugging FRDM-KL25Z with MCU-Link
The MCU-Link is a $10 CMSIS-DAP capable debug probe which works out-of-the box with the MCUXpresso Eclipse based IDE. This is great for development, but how can I programming with the push of a button or a script? The answer is no: there is an easy way to use the debug probe outside Eclipse from a shell script, and you can use that MCU-Link probe to do the job. This is especially useful as with the example below where I have to program 60 boards this week-end :-).

Batch Programming Boards with MCU-Link
Implementing low power in embedded applications implemented can be challenging. Measuring current consumption is a first step to see if the software changes indeed have an effect on the current consumed. The PEmicro Universal Multilink FX debug probe comes with a useful feature to provide power to the target and the same time to measure the current consumption and to show the current used in the Eclipse IDE:
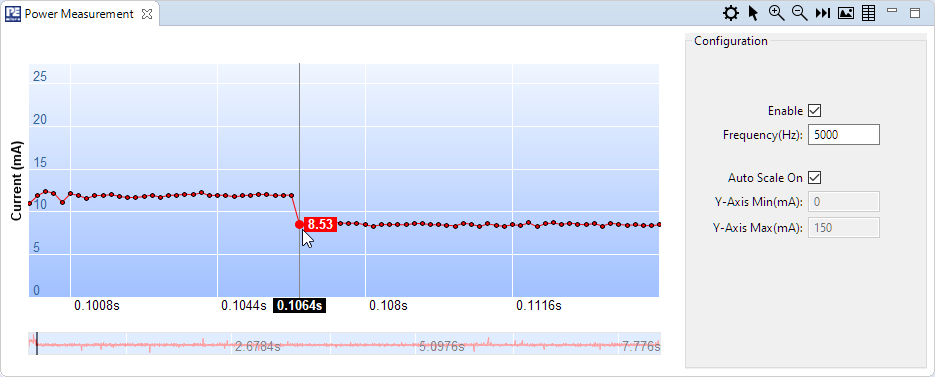
PEmicro power measurement
I have started the semester and labs using the MCUXpresso IDE V11.2.0 which has been available from July this year. The past week I received the notification that the update V11.2.1 is available: time to check it out….
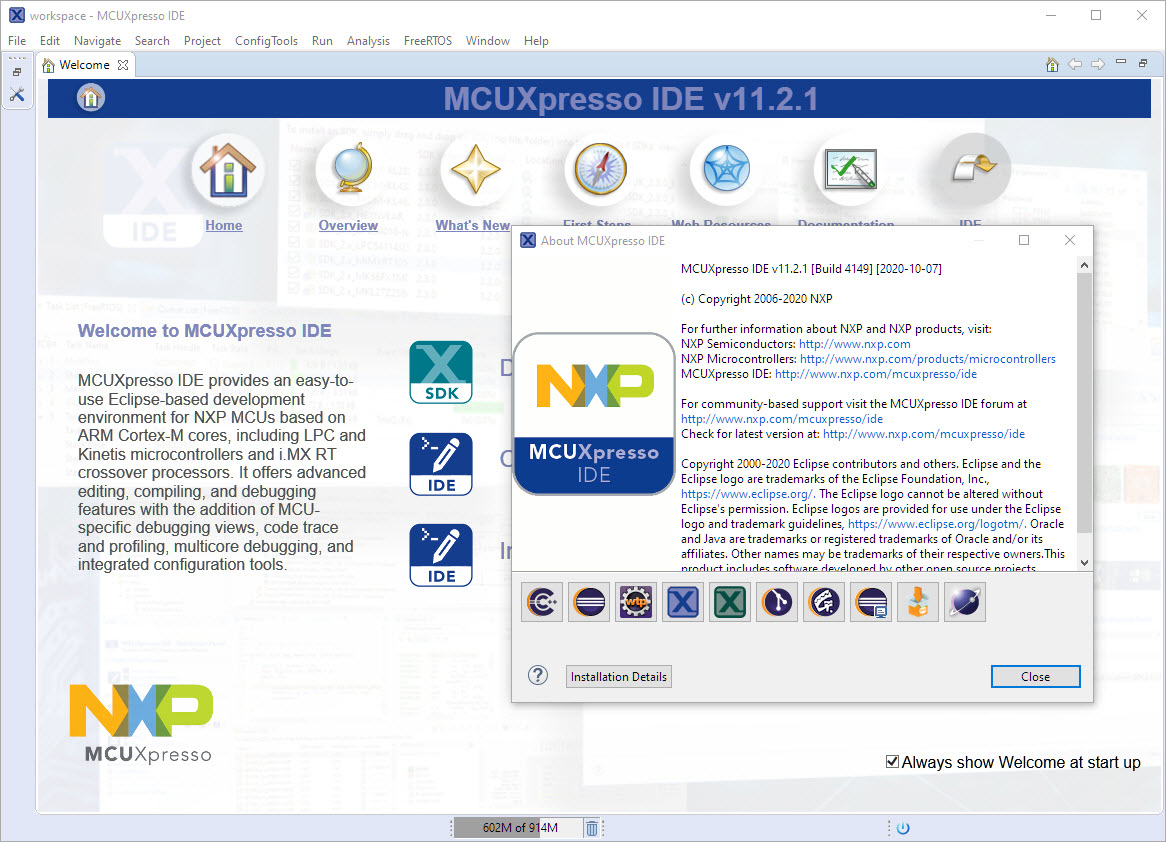
MCUXpresso IDE V11.2.1
At the university the end of a semester means that you have to get ready for the next semester. I always tend to use the latest and greatest tools for the labs. This week I received the notification that a new version of the Eclipse based MCUXpresso IDE is available, time to check it out for the next semester.

MCUXpresso IDE 11.2.0
Especially in a lab or classroom environment it is convenient to start with a template project, and then explore different ways to shape the project for different needs. As for any IDE of this world, this requires an understanding of the inner workings to get it right. So in this article I show how to copy, clone or rename properly an Eclipse ‘template’ project in the MCUXpresso IDE.
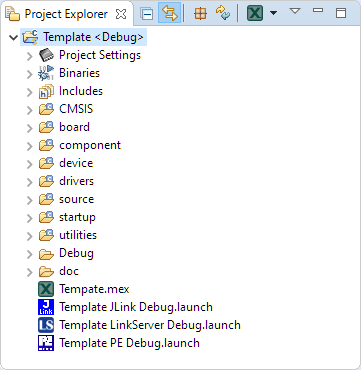
Template Project
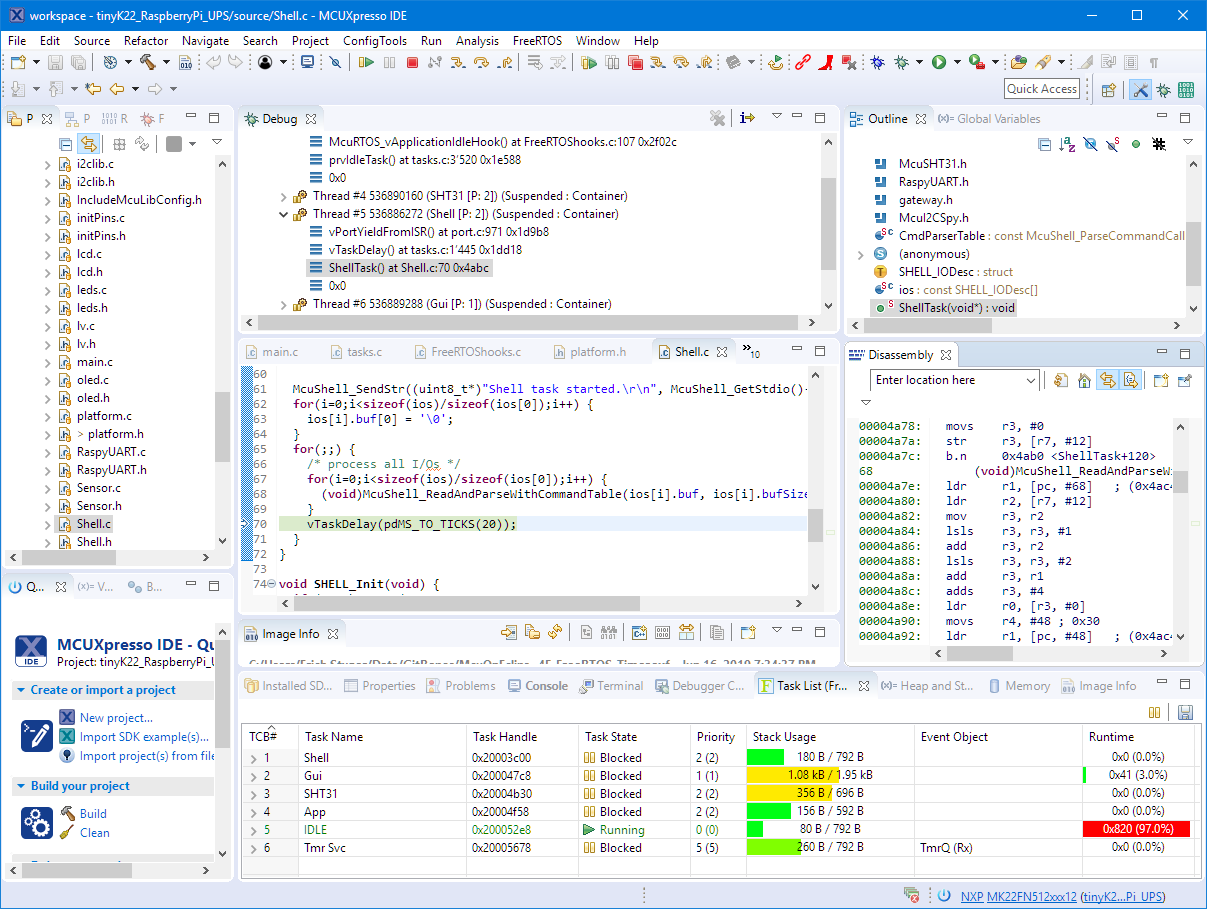
By default, Eclipse provides ‘stop-mode-debugging’: in order to inspect the target code and data, I have to stop the target. But with the right extensions as present in the Eclipse based MCUXpresso IDE, it is possible to inspect the target even while it is running.

Graphing Variables
A few days ago NXP has released a new version of their Eclipse IDE flagship: the MCUXpresso IDE v11.0.
NXP MCUXpresso IDE V11.0.0
The previous v10.3.1 was released back in Feb 2019, and the 11.0 now in June this year matches up with the Fall university semester. I appreciate that the releases are about every 6 months, so this gives me time to use it in my university lecture material and lab work. I had the weekend for trying it out, and I’m very pleased.
In a modern development workflow both command-line and a graphical user interface has its place. On the GUI side, Eclipse is famous that it offers many different ways to accomplish something which is great. But sometimes I continue to use an old habit or way because I have missed that there is a newer and better way, and the MCUXpresso Eclipse IDE is no exception to that. In this article I show a few ways how to use the mouse even more productive.

Project Settings
