
By default, Eclipse provides ‘stop-mode-debugging’: in order to inspect the target code and data, I have to stop the target. But with the right extensions as present in the Eclipse based MCUXpresso IDE, it is possible to inspect the target even while it is running.

Graphing Variables
Inspecting and visualizing variables with the debugger while the target is running is incredible useful: I don’t have to stop the target to inspect the state of the system. But of course there are limiations: The debug probe only can read memory mapped variables (so no CPU core registers), and the variables should be global (it does not make much sense to use local variables, as their location on the stack changes all the time). The amount of data (number of variables, frequency of updates) is limited, so this works for a few variables updated every few 100s of milliseconds. The feature is usually named ‘live variables’ or similar.
I’m using the NXP MCUXpresso IDE V11.0 which implements the ability to read and interact with the target while it is running (gdb non-stop mode). That features has been introduced from V11.2 and has been enhanced in later releases with V11 the most recent one.
The feature depends to some extend on the debug probe capabilities, and with V11 it works seamless for all supported probes, including P&E, SEGGER and the NXP LPC-Link2/CMSIS-DAP ones.
If using LinkServer as debug connection, make sure it is is in Non-Stop mode. If it is in full-stop mode, see https://mcuoneclipse.com/2019/01/13/gdb-all-stop-and-non-stop-mode-with-linkserver/ how to change an existing configuration.

LinkServer Non-Stop Mode
To monitor the variables, the ‘Global Variables’ view is used:

Global Variables View
Use the ‘glasses’ icon to open a dialog to select the variable(s) to monitor:

add global variables
The dialog has a filter functionality. Select the variables which shall be monitored:
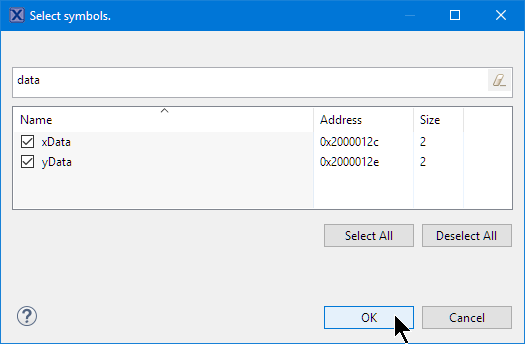
Select Symbols
The update frequency in milliseconds is configured in the view:

Update Frequency
With the ‘play’ button pressed, the variables in the list get updated with the specified update frequency. Changed values are marked with yellow background:

Update Variables while running
The view has a ‘Details’ pane: selecting one or more lines shows a graph of the variable over time:
Graphing Variables
The data can be plotted in different formats:

Show Details
including a list of values which can be exported too:

List of Values
Happy Variabling 🙂
Links
- MCUXpresso IDE 11.0: New NXP MCUXpresso Eclipse IDE v11.0
- MCUXpresso IDE 10.2: https://mcuoneclipse.com/2018/05/20/overview-of-mcuxpresso-ide-v10-2-0/
- Live Variables View in CodeWarrior: https://mcuoneclipse.com/2013/01/27/live-view-for-variables-and-memory/
- GDB all-stop and non-stop mode with LinkServer: https://mcuoneclipse.com/2019/01/13/gdb-all-stop-and-non-stop-mode-with-linkserver/

Hi Erich,
I apologize for using this article to get your attention. I’ve been looking for an email address to email you directly to no avail. I posted about my issue on NXP forum community about using MCU MKL28Z’s flash memory to read/write data that are needed by my product to be persistent even when powered down, in order to have the data available on power up. And sorry I’m not on twitter or IG.
(I’ll be quoting below to my nxp forum question/post with the hope that I can get your attention & answer me there too besides directly emailing me.)
I just found your old blog, https://mcuoneclipse.com/2014/05/31/configuration-data-using-the-internal-flash-instead-of-an-external-eeprom/, about reading/writing data.
It seems viable for my application but I’m on MCUXpresso IDE. I have not seen you reply to my post on NXP forum maybe because it’s under a different category?
Do you mind emailing me directly &/or responding also to my question at this link:
https://community.nxp.com/thread/508537
For any project in MCUXpresso, under Properties, there’s the C/C++Build -> MCU settings -> Default LinkServer Flash Driver Memory Map. Based on your example, I wonder if I need to MODIFY (“Split’ button) the Flash Area so the flash program space will separate from the planned data flash space?
Also under Debug Configurations (I use PEmicro Debugger) -> Debugger tab – Advance Options button, on the pop-up window, there is option to “preserve” non-volatile memory by range from & to boxes.
The Flash memory range of MKL28Z is 00000000-0007fffh. Do I just define a memory block within that range that I know should be protected from flash erasure & code programming by using that “advance” options under debug configurations?
Outside of debugging, how will this allocated data memory space pan out when binary code flashing with standalone programmers?
Is the data range now based on what’s defined in my FIRMWARE in a header .h file, by HARDCODING those addresses to read/write from & creating special function calls in a source .c file like you have done in your example?
Please advise.
Thanks for the help.
MI
LikeLike
Hi Mi,
just for the record: there is a contact information available on https://mcuoneclipse.com/about/
Erich
LikeLike
Hi Mi,
I’ll respond to that forum thread too.
Erich
LikeLike
Yes, Erich, I saw & responded there. Great info & related post links. I’m devouring all right now. If you see the “Memory details” window screenshot on my recent response this morning, it shows how it is in MCUXpresso very similar to your article how you did it in PE. …
LikeLike
… P.S. and sorry I just saw your contact info… I went there yesterday but I did NOT scroll down the page :-(… see you over at NXP post. Thanks so much!!!
LikeLike
… P.S. I just saw your contact info now… I went to About yesterday but I did not scroll down at the bottom… sorry 😦 See you over at the NXP posted question… Thanks so much for all the clear articles. You are truly a very good professor/teacher.
LikeLiked by 1 person
Pingback: Enable Default FreeRTOS Debugging for LinkServer Debug Connections | MCU on Eclipse
Pingback: Visualizing Data with Eclipse, gdb and gnuplot | MCU on Eclipse
What an amazing website….
LikeLike
I have an old project built with MCUXpresso IDE v11.2.1. Now I would like to debug a running board without stopping or resetting it, so I follow the instructions on this page of your blog.
Unfortunately on my IDE, there isn’t “Add new expression” in Global Variables view. It is shown only if I click on “Suspend”, i.e. stop the execution, but this isn’t what I want (mostly because watchdog is enabled).
LikeLiked by 1 person
With that view, you have to stop/suspend the target first, so you can enable the functionality. After that you can continue and see the variables/etc changing.
If you want to monitor something ‘on-the-fly’, I recommend you turn on SEGGER RTT in your application (e.g. see https://mcuoneclipse.com/2015/07/07/using-segger-real-time-terminal-rtt-with-eclipse/ ) and then use the J-Scope application (see https://www.segger.com/products/debug-probes/j-link/tools/j-scope/) to monitor the variable(s).
LikeLike