GDB supports a mode which allows the GDB debug client to read memory while the target is running. This allows features like ‘live variables’: that way I can see the variables refreshed and changing over time without halting the target. Another functionality which comes with that feature is to check stopped threads or to see all threads in the system.

multiple FreeRTOS threads in debug view
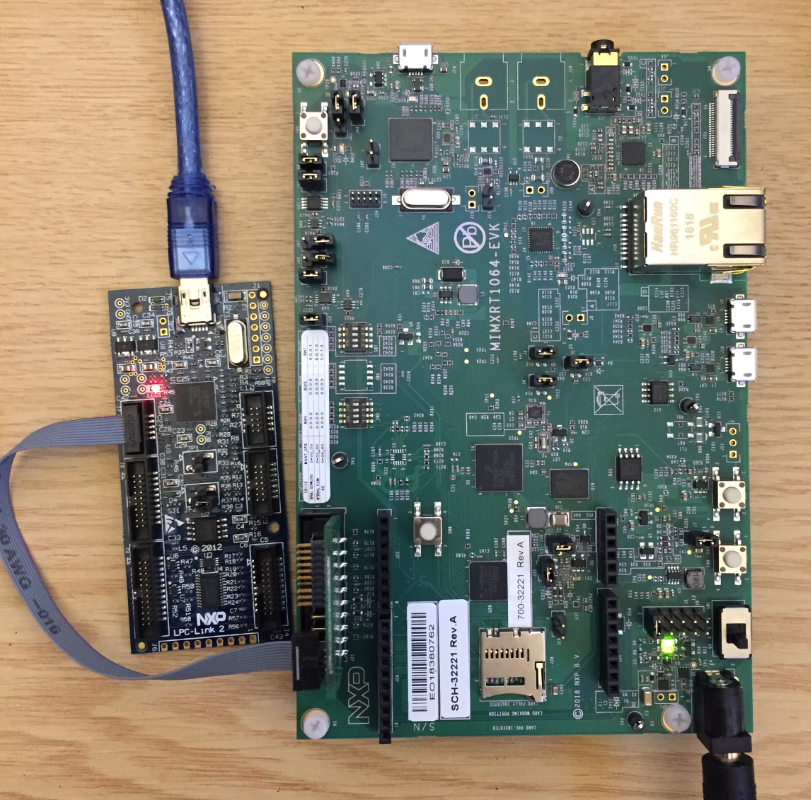
Debugging i.MX RT1064 with NXP LPC-Link2 using LinkSever
When creating in MCUXpresso IDE a new launch configuration for LinkServer, I have the opportunity to select the mode I want to use:

connect to target
Depending on Non-Stop or All-Stop, different features are available with the LinkServer debug connection.
Non-Stop Mode
This is the default mode.The default can be changed in the workspace preferences:

enable non-stop mode in workspace preferences
If in Non-Stop mode, this can be verified in the Console with the messages produced by the LinkServer:
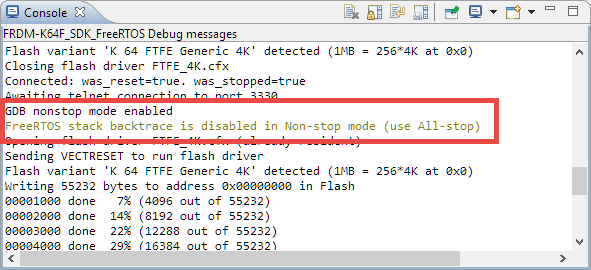
gdb non-stop mode
All-Stop Mode
If in All-Stop mode, this can be verified in the Console with the messages produced by the LinkServer:
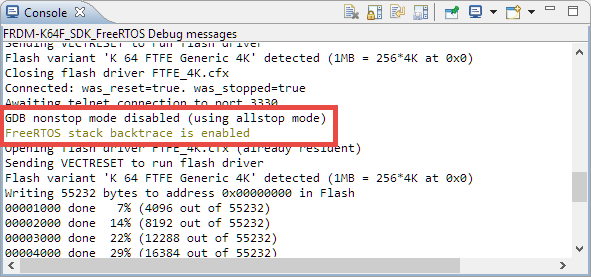
all-stop mode
Comparison All-Stop and Non-Stop Mode
The following gives an overview what is supported in each mode:
Non-Stop (default):
- Ability to access variables while the target is running (Live Variables View) and plot them over time (see this article).
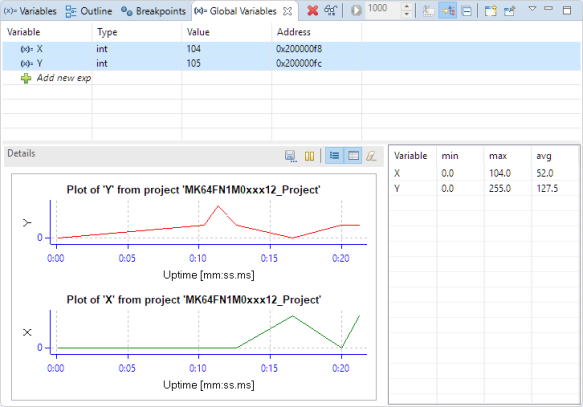
Plot Variables over Time
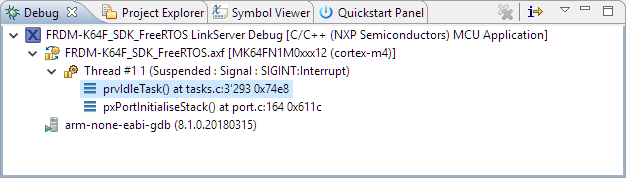
- Only the currently active FreeRTOS thread is shown in the Debug view:

debug threads in non-stop mode

All-Stop:
- Cannot access variables while the target is running. No Live Variables View
- All FreeRTOS threads are shown in the debug view
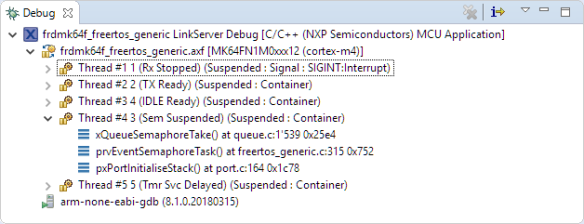
multiple freertos threads in debug view in all-stop mode
Obviously, for debugging FreeRTOS applications I prefer the All-Stop mode. But then I don’t have the Live Variables view available with LinkServer.
Eclipse Launch Configurations: Switching between All-Stop and Non-Stop Mode
One simple way is to delete any existing LinkServer launch configuration: next time it will do a probe scan and give me the opportunity to select which mode I want to use.
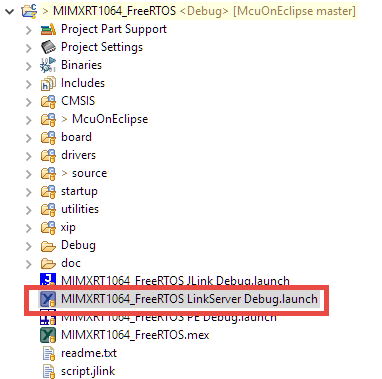
linkserver launch configuration
Another way is to change the launch configuration setting. For this I double-click on the launch configuration to open it. I have to change two settings.
One setting is in the Debugger > Main tab:
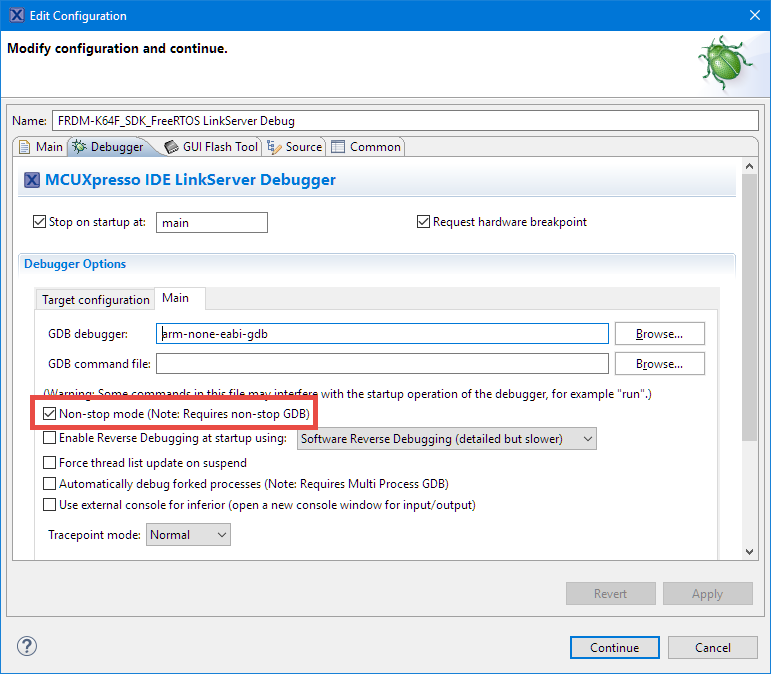
non-stop mode setting in launch configuration
For ‘non-stop’ mode have that check box checked.
The other setting is under Target configuration > Edit Scripts. Press that button:

target configuration edit scripts
This gives a dialog to edit the scripts:

edit scripts dialog
Below are the Init commands for all-stop mode:
set remotetimeout 60000
##target_extended_remote##
set mem inaccessible-by-default ${mem.access}
mon ondisconnect ${ondisconnect}
set arm force-mode thumb
${load}
And here the ones for non-stop:
set non-stop on
set pagination off
set mi-async

set remotetimeout 60000
##target_extended_remote##
set mem inaccessible-by-default ${mem.access}
mon ondisconnect ${ondisconnect}
set arm force-mode thumb
${load}
So the difference are the three commands marked in red. So what I do is to comment/uncomment these commands in that dialog:
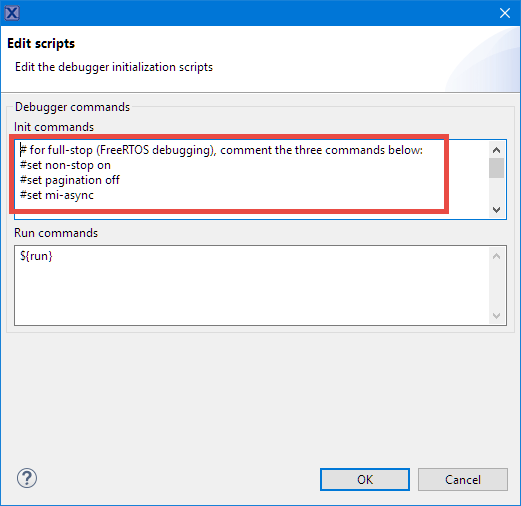
commented for full stop
Summary
GDB offers Non-Stop and All-Stop mode. Non-Stop allows to read variables while the target is running, and the All-Stop mode is required for the LinkServer connection to show all FreeRTOS threads. I can select the mode at Eclipse launch configuration creation or later with two settings in the launch configuation itself.
Happy Stopping 🙂
Links
- GDB All-Stop Mode: https://sourceware.org/gdb/onlinedocs/gdb/All_002dStop-Mode.html#All_002dStop-Mode
- GDB Non-Stop Mode: https://sourceware.org/gdb/onlinedocs/gdb/Non_002dStop-Mode.html#Non_002dStop-Mode
- MCUXpresso IDE 10.3.0 release: New NXP MCUXpresso IDE V10.3.0 Release

Pingback: First Steps with the LPC55S69-EVK (Dual-Core ARM Cortex-M33 with Trustzone) | MCU on Eclipse
Pingback: Visualizing Global Variables while Target is Running with Eclipse and MCUXpresso IDE | MCU on Eclipse
Pingback: Enable Default FreeRTOS Debugging for LinkServer Debug Connections | MCU on Eclipse