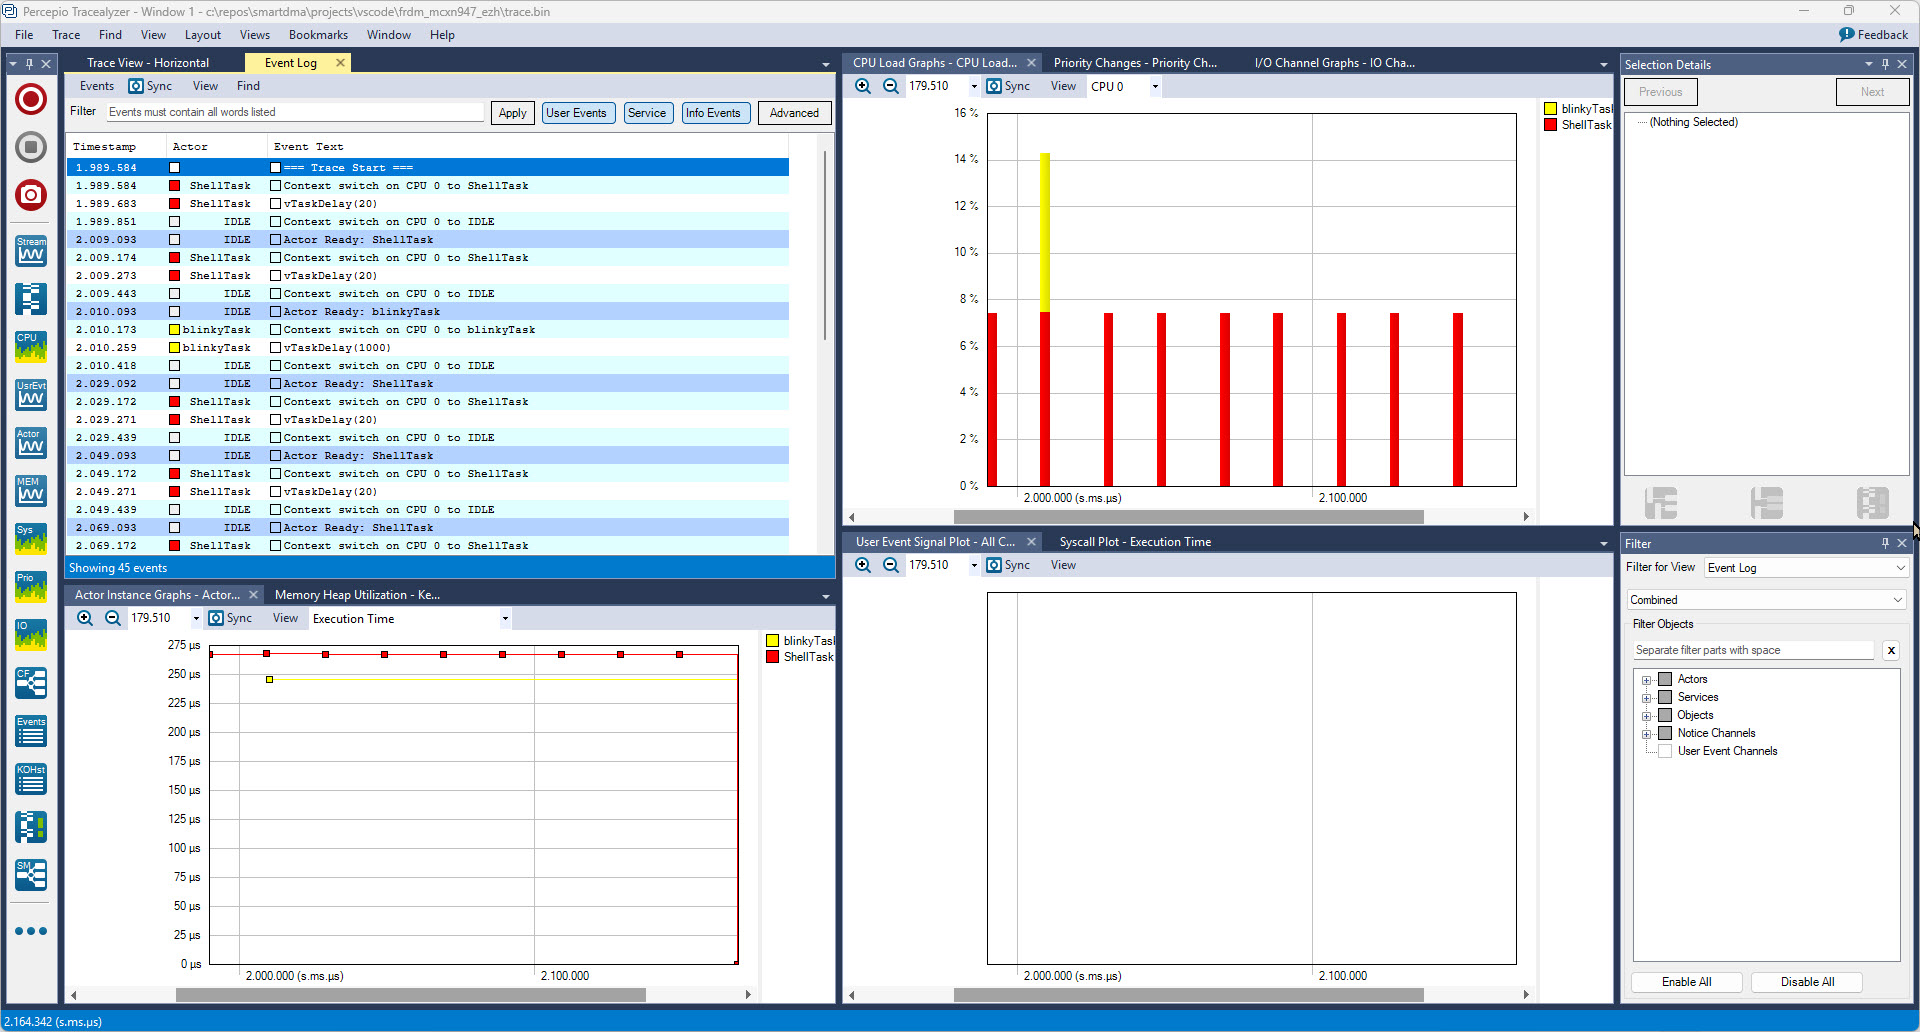
In my latest research project I’m using the NXP FRDM-MCXN947 board. As part of that project I have to collect and export application trace data for later analysis. In that project I’m using the the Tracealyzer product from Percepio.
Trace Data in Percepio Tracealyzer
In this article I describe different ways to export trace data from the embedded target: using generic GDB commands or with an trace exporter in VS Code.
The ARM Cortex M architecture has many features which are underused, probably simply because engineers are not aware of it. SWO (Single Wire Output) is a single trace pin of the ARM Cortex-M CoreSight debug block. trace pin uses the ITM (Instruction Trace Macrocell) on ARM Cortex. It provides a serial output channel, at a high speed higher than the usual UART, because it is clocked at half or a quarter of the core clock frequency, depending on the core and implementation.
As such, it is an ideal high speed output channel to send text or data to the host. This is how it is usually used, but what is unknown to many: it can be used in a bidirectional way with the help of the debugger.
The topic of this article: how to redirect standard I/O like printf() or scanf() using the SWO ITM console: means both sending *and* receiving data over the SWO debug channel: that way I can use it as a kind of UART with a single pin only.
One major concern of embedded system development is performance. Microcontroller have more MHz than in the past, but embedded applications are all about timing and real-time aspects.
The challenge is: how to get data off the target in realtime? SWO can help with this….
In my “Tutorial: Catching Rogue Memory Accesses with Eclipse and GDB Watchpoints” I have used Eclipse/CDT and GDB watchpoints. I used a conditional watchpoint, but this comes with a performance hit. In this article I show how to use the ARM Cortex trace hardware to catch specific writes to a memory location. Without severe performance degradation. But for this I need a little helper: the DEADBEEF catcher!
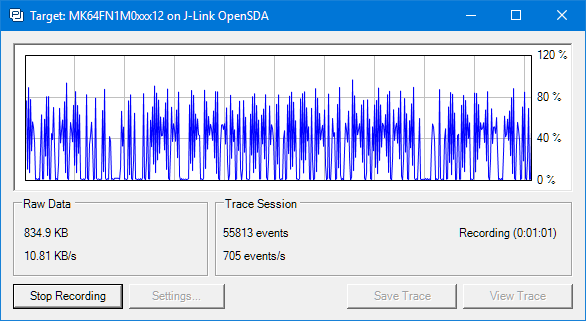
To solve the real hard problem of Embedded Systems development, I usually need all the data I can get from the target. The Percepio Tracealizer is such a tool which can stream application and FreeRTOS trace from the target over a Segger J-Link connection using the Segger RTT protocol. I’m using that combination a lot.
Streaming trace data that way does not need a dedicated hardware like ETM Trace. Using RTT is usually not much intrusive and affects the performance of the target in the 1-2% range (of course depending on the amount of data).
But what worried me for several weeks is that after moving to FreeRTOS V10.0.0 and the same time updating the Segger libraries, the target performance was heavily affected:
In “Cycle Counting on ARM Cortex-M with DWT” I have used the ARM DWT register to count the executed cycles. With the MCUXpresso IDE comes with a very useful feature: it can capture the ARM SWO (Single Wire Output) trace data. One special kind of trace data is the ‘cycle counter’ information which is sent through SWO.
Questions from students or readers of my articles are a great source for all kind of articles. And here is the ‘question of this week’: “What is realtime debugging”?
It’s a good question because the topic of ‘realtime’ and ‘debugging’ was a topic in the lectures this week. So this question gives me the opportunity to combine the two things of ‘realtime’ and ‘debugging’, I love it :-).
Good news for everyone using Eclipse, FreeRTOS and Percepio Tracealyzer: Percepio has released an Eclipse plugin which makes snapshot tracing very easy and convenient using the a GNU gdb debugger in Eclipse like Kinetis Design Studio:
Time is passing by so fast, and the year end is approache fast! I’m pleased to announce that a new release of the McuOnEclipse components is available in SourceForge:
Percepio Trace V3.1 for FreeRTOS which includes both Segger RTT continuous streaming and snapshot tracing in a single API
Generation of sources and drivers so they can be used without Processor Expert using McuLibConfig, removal of dependency to NXP Kinetis SDK: components use a generic API approach to have them working with other SDKs.
New contributed ExceptionsHandler component
Callback Setter and Getter in USB CDC stack for simpler option handling
GenericTimeDate with flexible RTC support and added Unix Timestamp functions
LongKey events in Key component
FreeRTOS with optimized task selection on Cortex-M4/M7
It seems to me that not many developers use hardware trace? ARM indicates that maybe only <5% of developers are using trace. Too bad! Why are all the ARM Cortex microcontroller vendors putting a powerful hardware (and complicated!) trace engine into their devices, if only few developers are using it? Seems like a waste of silicon and an unnecessary price adder? Well, hardware trace can be a life saver: Because only with hardware trace the most complicated bugs and problems can be solved. And maybe because only the best are using it ;-).
In this article I proudly present my research how to get instruction trace out of the ARM Cortex-M4 microcontroller on a NXP TWR-K64F120M board with a Segger J-Trace for ARM: