Tutorial: Getting ETM Instruction Trace with NXP Kinetis ARM Cortex-M4F

It seems to me that not many developers use hardware trace? ARM indicates that maybe only <5% of developers are using trace. Too bad! Why are all the ARM Cortex microcontroller vendors putting a powerful hardware (and complicated!) trace engine into their devices, if only few developers are using it? Seems like a waste of silicon and an unnecessary price adder? Well, hardware trace can be a life saver: Because only with hardware trace the most complicated bugs and problems can be solved. And maybe because only the best are using it ;-).

In this article I proudly present my research how to get instruction trace out of the ARM Cortex-M4 microcontroller on a NXP TWR-K64F120M board with a Segger J-Trace for ARM:

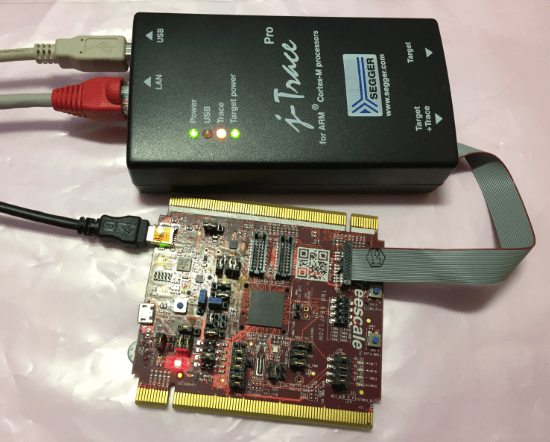
J-TRACE tracing NXP TWR-K64F Board

J-TRACE tracing NXP TWR-K64F Board

Continue reading

First Steps with Ozone and the Segger J-Link Trace Pro

From time to time I face some problems which are really hard to find. Mostly these kind of bugs are very timing sensitive and depend on interrupt execution order. Maybe a dangling pointer is overwriting memory, code is running wild, or some functions are not reentrant as they should be. For these kind of bugs, good tools are worth their weight in gold. The Percepio FreeRTOS+Trace and the Segger SystemView have helped me many times to narrow down such kind problems in my applications. Another ultimate tools is hardware trace: Now I have a Segger J-Trace Pro for ARM Cortex-M in my arsenal of bug extinguishing weapons on my desk:
Dear bugs, look what I have on my desk. Your hiding time is over! 🙂

tracing-cortex-m4-with-j-trace

tracing-cortex-m4-with-j-trace

Continue reading