The great thing with open source tools like Eclipse and GNU (gcc, gdb) is that there is a wealth of excellent tools: one thing I had in mind to explore for a while is how to generate code coverage of my embedded application. Yes, GNU and Eclipse comes with code profiling and code coverage tools, all for free! The only downside seems to be that these tools seems to be rarely used for embedded targets. Maybe that knowledge is not widely available? So here is my attempt to change this :-).
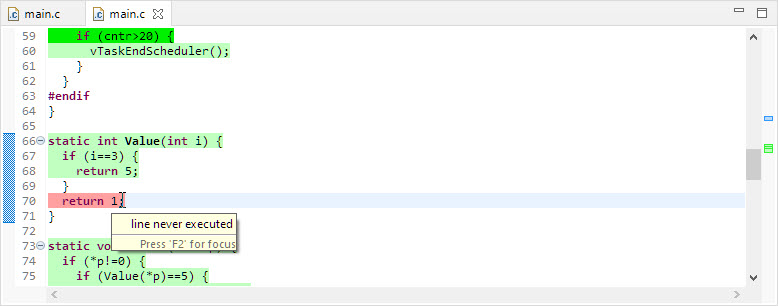
Or: How cool is it to see in Eclipse how many times a line in my sources has been executed?
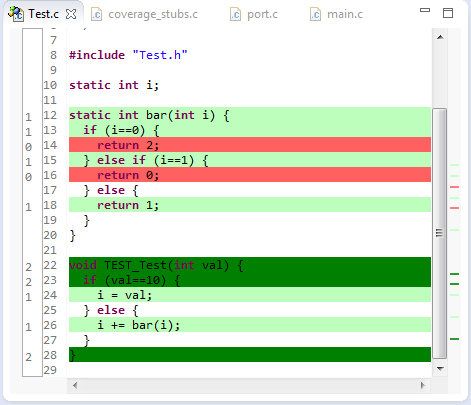
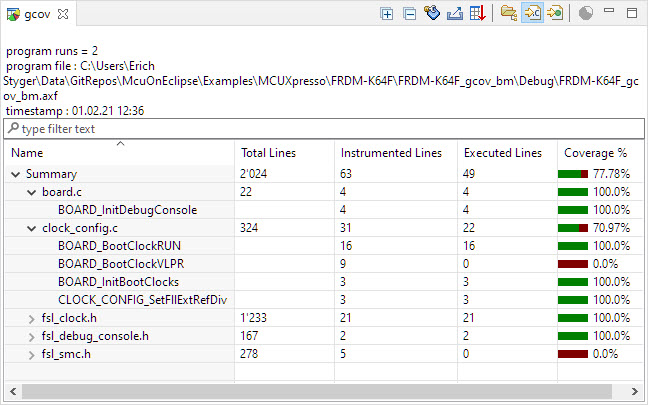
Line Coverage in Eclipse
And best of all, it does not stop here….
Continue reading →