If you are developing Linux or desktop applications with GNU tools, you very likely are familiar with gcov: the GNU coverage tool. It collects data what parts of the code gets executed and represents that in different formats, great to check what is really used in the application code or what has been covered during multiple test runs.
Coverage Information with gcov
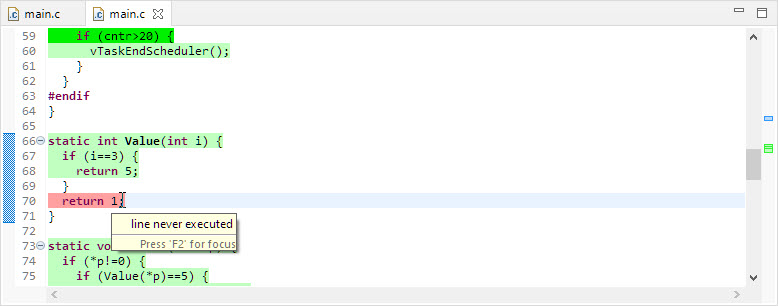
line never executed
GNU coverage is possible for resource constraint embedded systems too: it still needs some extra RAM and code space, but very well spent for gathering metrics and improves the firmware quality. As I wrote in “MCUXpresso IDE V11.3.0 for 2021” things are now easier to use, so here is a short tutorial how to use it.
Outline
For how gcov works, have a read at gcov for Embedded. This tutorial shows how to use gcov with the MCUXpresso IDE V11.3.0. As board I’m using the FRDM-K64F, and you can find the example project on GitHub.
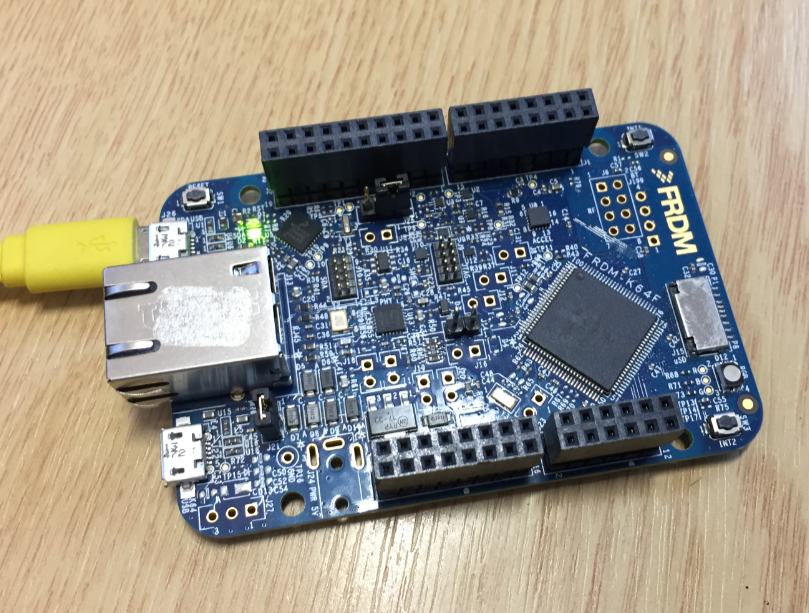
NXP FRDM-K64F Board
To generate coverage we need:
- Eclipse with the gcov plugins (they are already installed in MCUXpresso IDE 11.3.0)
- GNU binaries without the ‘arm-none-eabi’ prefix: I use a batch file for this
- A project to collect coverage information
We will instrument source files go produce .gcno files on the host. The instrumented application will generate .gcda files we store on the host using semihosting. The gcov tool then will show the reports in the IDE or on the command line:
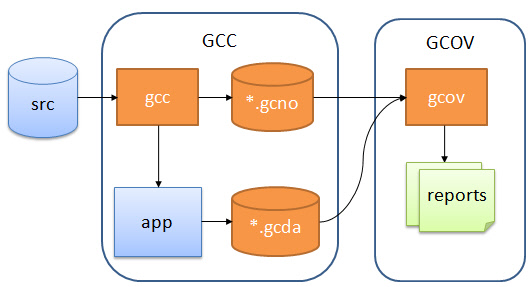
General gcov Flow
The files and project used in this article can be found on GitHub.
Creating Project
I recommend to get familiar with gcov using a small and bare metal project. I have created a project with the IDE and the MCUXpresso SDK.
Make sure the project is using newlib (nano) with semihosting:
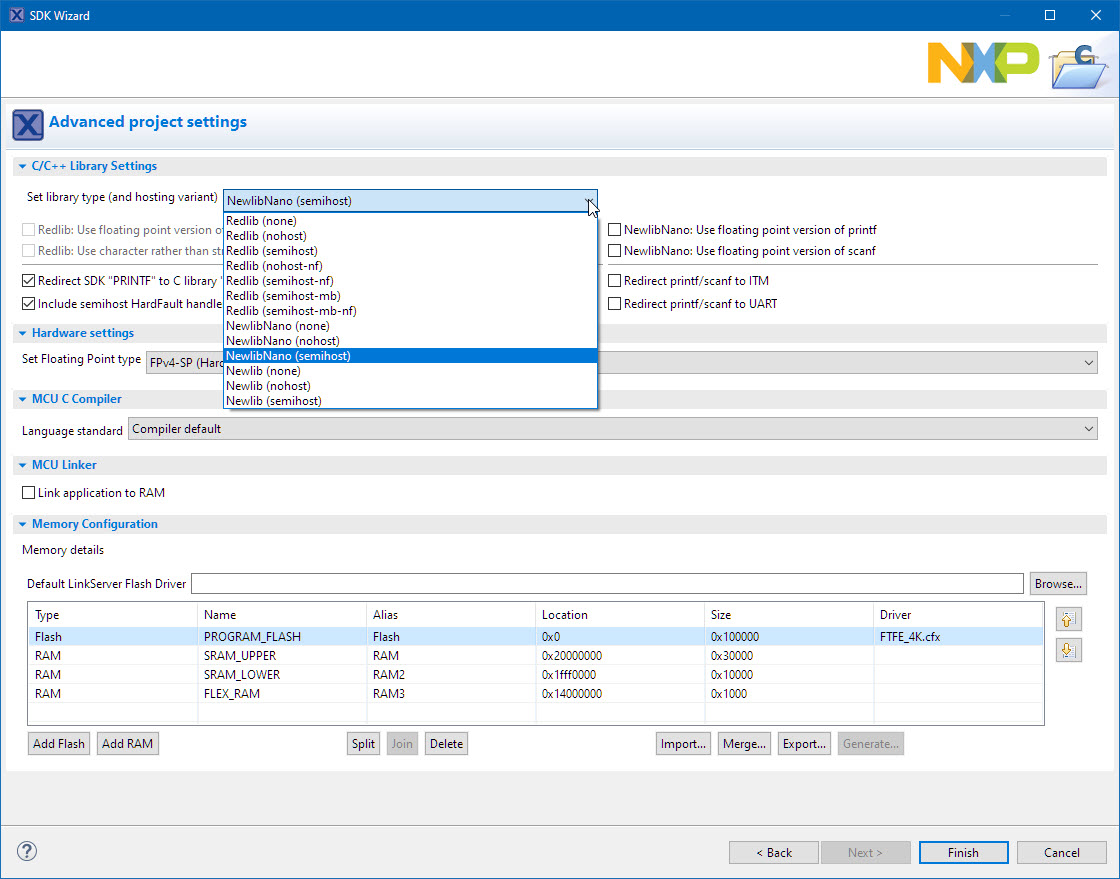
newlib nano with semihost
This creates the project:
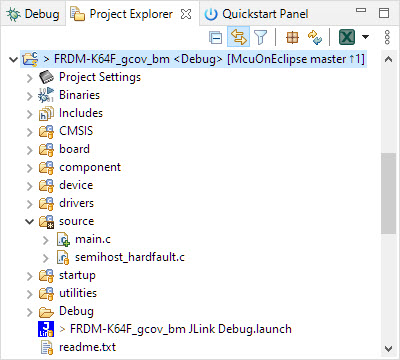
bare metal project
Linker Constructor Symbols
Each instrumented file will generate a special constructor which needs to be called later. To be able to call them, we need to include them into our binary and mark them with special symbols. This is done in MCUXpresso IDE with a special FreeMarker Linker script:
/************************************************
* start of main_text.ldt: *
************************************************/
. = ALIGN(4);
*(.text*)
/* added in template for gcov: */
. = ALIGN(4);
PROVIDE_HIDDEN (__init_array_start = .);
KEEP (*(SORT(.init_array.*)))
KEEP (*(.init_array*))
PROVIDE_HIDDEN (__init_array_end = .);
/************************************************
* end of main_text.ldt *
************************************************/
Create a file named main_text.ldt and place it into the folder linkscripts in the project root (or copy it from GitHub):
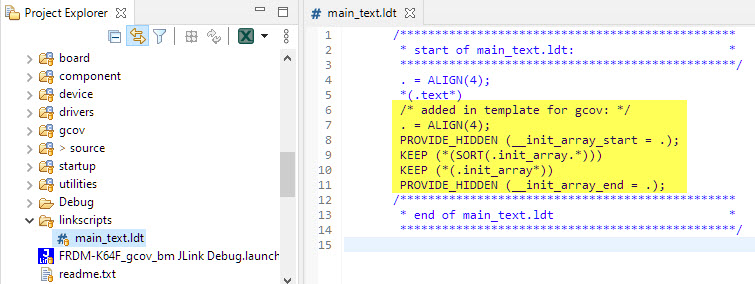
linker script entry for gcov
Support Files
To write the data, a few hooks and helpers are needed. You can find them in the ‘gcov’ folder of my project on GitHub:
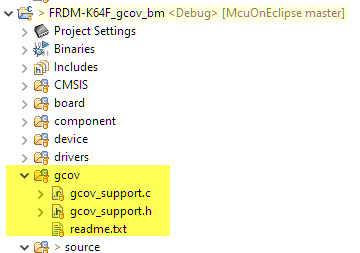
gcov support files
Add it to the project; we will use it in the next step.
Init and Data Writing
The gcov library needs to be initialized. Include the header file:l
#include "../gcov/gcov_support.h"
Call
gcov_init(); /* initialize library */
at the start of main(). Then run the instrumented code. At the end, call
gcov_write();
to write the data;

gcov init and writing data
Heap and Stack
The application on the board writes the collected data to the host via semi-hosting file I/O. Unfortunately file I/O is not very lightweight, and most issues with using gcov for embedded systems are because lack of stack and heap space.
Typically the default heap and stack size will not be enough, so I recommend to assign a good chunk of memory in case of issues: the more the better.
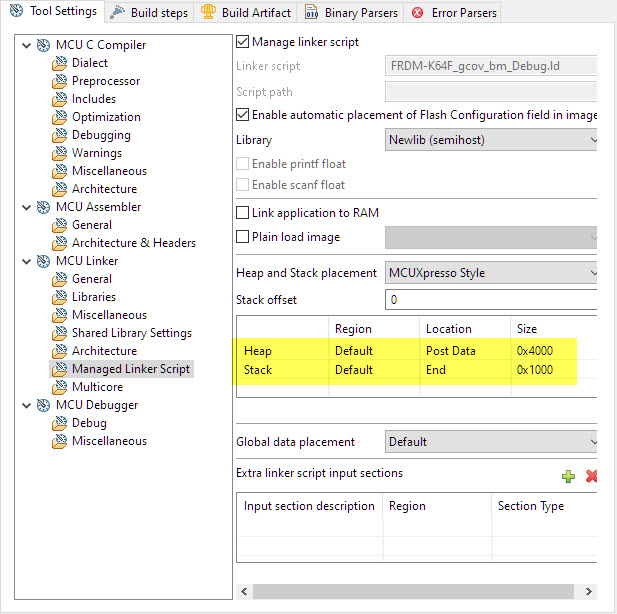
Heap and Stack Space
Instrumenting Source Files
Each file which shall be instrumented for coverage needs to have the following options added:
-fprofile-arcs -ftest-coverage
I recommend as a starter just to instrument one file, or very few.

added instrumentation option for coverage
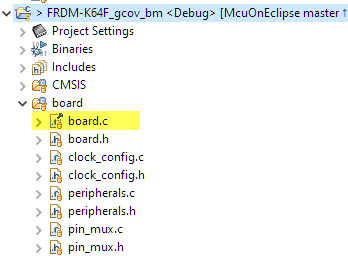
custom options for board.c
Finally, add the option
-fprofile-arcs
to the linker settings to ensure it links with the proper library support.

Linker Flags
💡 instead of
-fprofile-arcsthe option--coveragecan be used.
Now it is a good time to perform a Project > Clean followed by a Project > Build. It shall now generate .gcno files in the output folder:
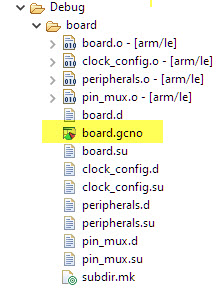
gcno file
Collecting Coverage
Now you can run the application: it will collect information from the instrumented code and write the .gcda files on the host using semi-hosting file I/O:

gcda coverage data files in Debug folder on host
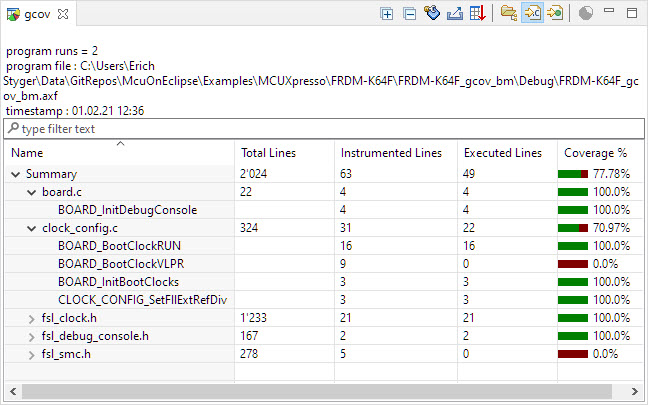
Viewing Coverage Information
Double-click on any of the .gda files and it will open a graphical view:

Coverage Information with gcov
Tadaaaaa! 🙂
Double-clicking on a line shows the information with colors in the source view:

execution coverage
Gcovr
If you want to use the gcov data outside of Eclipse, have a look at https://github.com/gcovr/gcovr. It has a feature to add and combine different coverage data files too.
Summary
Coverage tells which lines of code have been executed. This is very important to get good test coverage and can increase software quality. Traditionally coverage as GNU gcov has been used on host applications, but it is possible to use it for embedded targets as well. The latest NXP MCUXpresso IDE 11.3.0 makes it even easier as all the needed tools are already installed: that way I can start collecting coverage information from the target and view and analyze it on the host.
Happy covering 🙂
Links
- Adding GNU Coverage Tools to Eclipse
- MCUXpresso IDE V11.3.0 for 2021
- GNU Coverage Tool: https://gcc.gnu.org/onlinedocs/gcc/Gcov.html
- Code Coverage for Embedded Target with Eclipse, gcc and gcov: https://mcuoneclipse.com/2014/12/26/code-coverage-for-embedded-target-with-eclipse-gcc-and-gcov/
- Code Coverage with gcov, launchpad tools and Eclipse Kinetis Design Studio V3.0.0: https://mcuoneclipse.com/2015/05/31/code-coverage-with-gcov-launchpad-tools-and-eclipse-kinetis-design-studio-v3-0-0/
- Files of this project on GitHub: https://github.com/ErichStyger/mcuoneclipse/tree/master/Examples/MCUXpresso/FRDM-K64F/FRDM-K64F_gcov_bm

Thanks Erich, very interesting! A couple questions:
1) C++ projects will already have everything need in linker script, right?
2) Can you explain why we need GNU binaries without the ‘arm-none-eabi’ prefix?
Thanks!
Best Regards, Dave
LikeLiked by 1 person
Hi Dave,
1) Yes, in that case the constructors get called by __libc_init_array()
2) Because they are used by the Eclipse plugins (e.g. to find the address of a symbol, etc). Eclipse does not care (or know) if the device is an ARM, so it just calls gcov instead of arm-none-eabi-gcov
I hope that makes sense.
LikeLike
Hi Erich,
Thank you for the tutorial.
Two questions:
1. What is the overhead of adding the GCOV functionality? You mention increasing stack size “a good chunk” but is there a rule of thumb of how much to add to the stack and how much is added to the executable (Flash) code?
2. Is there a way of turning this on/off using build flags? I use a few PRINTFs in my code for development but control whether or not they’re in the build using the “SDK_DEBUGCONSOLE” flag (“0” & “1” for debug, “2” for release). From what I see here, it seems like you have to have two copies of the code, one with the GCOV functionality for testing and one for release.
Thanx,
myke
LikeLiked by 1 person
Hi Mike,
1. There is some data and rational about how much will be used in https://mcuoneclipse.com/2014/12/26/code-coverage-for-embedded-target-with-eclipse-gcc-and-gcov/ . Basically there is the overhead in the code to store the data plus the data needed for the arcs. The amount of arcs depend on the control flow (how many changes in flow there are), plus there is the code for the coverage data library. For the example in this article I compared it with a un-instrumented version: FLASH 11kByte vs. 57kByte, Heap 1.4kByte vs. 4.7kByte and stack 120 Bytes vs. 400 Bytes.
This was with newlib-nano: newlib tends to use more heap and stack (but I rarely use newlib).
2. Yes, you can turn it off with having a build configuration without the options (instrumentation and linker) and one without. No need to have separate copies of the code.
LikeLiked by 1 person
Thank you for the answers.
That’s a very significant amount of overhead. I was expecting 10% to 25%, not multiples of the various memory blocks. Years ago, I worked with similar tools on (IBM) mainframe applications and the overhead there was in the range of 5% in terms of additional code and RAM requirements.
I have to wonder about the practicality of using this tool for MCUs other than in an educational setting. If I’m developing for a product, I want the minimum MCU that will do the job which means as little Flash/SRAM as possible to minimize costs. If I’m doing a reasonably small application, then this tool could be considered for family parts with multiple Flash/SRAM sizes BUT they don’t tend to be in the same packages as the family parts with the smaller Flash/SRAM sizes.
myke
LikeLiked by 1 person
Hi myke,
there is base amount which gets added, and this does not grow that much per file: again it depends on the complexity of the code. I just instrumented two more files, and the code size increased from 56752 bytes to 57976 bytes. This was compiling without any optimizations.
It clearly does not work if you don’t have some headroom in RAM and FLASH: but you don’t have to instrument everything: you can do incremental coverage too.
Some Kinetis devices are pin compatible with larger RAM and FLASH sizes: for some projects I did the coverage on the larger one.
The other approach I use is to have the firmware ported to larger device (say the K64F) and with this one I’m able to do coverage for the application part and some parts of the application (like specific hardware on the final device) replaced with mock objects.
LikeLiked by 1 person
Hey Erich,
That sounds a lot more reasonable in terms of overhead – thank you for doing the checks. The 2% you’re reporting is much more in line with what I would think is reasonable.
It’s not just Kinetis with the package pin counts being a function of the Flash/SRAM, many other manufacturer’s devices follow a similar approach when selecting packages for the chips inside.
Keep well and safe!
LikeLiked by 1 person
Pingback: GNU Code Coverage on Embedded Target with Eclipse Neon and ARM gcc 5 | MCU on Eclipse
Would this be possible on CodeWarrior?
LikeLike
In principle: yes. But I have not tried it. It might depend on the GNU library used at that time.
LikeLike
Hi, Iam trying to use your exemple on my project.
I have :
-STM32CubeIDE
-STM32F439II
-SEGGER Jlink
When i start debuging, program freeze when __gcov_flush() is called (via gcov_write).
Do you have an idea of what may be the cause ?
Thanks
LikeLiked by 1 person
There might be a problem with the GNU library you are using. I have seen reports that some versions might create a circular list of coverage information. Did you halt it with the debugger to see what is going on? Otherwise try with an even simpler example? Switching between newlib-nano and newlib might help?
LikeLike
Hello Erich,
Your post very helpful.
But I have some query according to my project.
Currently I am using below software and hardware tools.
– MCUXpresso IDE v11.4.0 [Build 6224] [2021-07-15]
– Board : IMXRT1170
– Generating gcov report for MIPI Drivers files.
1) I can able to generate the “.gcno” file.
2) But I can’t able to generate the “.gcda” file.
– I have added “-fprofile-arcs -ftest-coverage” this flag in both MCU compiler and MCU Linker.
– When I am adding this flag to MCU Linker It’s showing below error.
Error_description : “-f may not be used without -shared ”
– Also I have resolved this error using enable the shared library option but after that my project was
can’t load into the board.
– Can you guide me on above issue.
Thanks In Advance.
LikeLiked by 1 person
>>2) But I can’t able to generate the “.gcda” file.
The .gcda files are generated by the runtime. Is your semihosting with file I/O working? You should use the SEGGER firmware/J-Link for this.
Please check my project on GitHub for the settings if you are not sure.
LikeLike
Is it necessary we can use only SEGGER firmware/J-Link for this?
Because, Right now i am debugging using USB cable only.
LikeLike
It does not matter what debug connection your are using, but it needs to be able to perform semihosting with file I/O supported. The J-Link firmware is able to do this, I don’t know if others can do this too.
>>Right now i am debugging using USB cable only.
I’m debugging with an USB cable for all my debug probes too :-). Seriously, it does not matter if it is an on-board debug probe or an external one. It just needs to support semihosting with file I/O. So ‘printf’ semihosting is not enough, the semihosting needs to be able to open/create/write files on the host. Again: the Segger one is able to do this.
LikeLike
>>– I have added “-fprofile-arcs -ftest-coverage” this flag in both MCU compiler and MCU Linker.
Add following to the linker: MCU Linker > Miscellaneous > Linker Flags: –coverage
For the files you want to get coverage: check the ‘Generate gcov information (-ftest-coverage -fprofile-arcs)’ in the MCU C compiler settings > Debugging
LikeLike
Hello Erich
I have used different flag in MCU Linker > Miscellaneous > Linker Flags:
1) –coverage : It’s showing error :- unrecognized option ‘–coverage’
2)–code-coverage : It’s showing error :- unrecognized option ‘)–code-coverage’
3) -lgcov : No Error but no any “.gcda” file generated.
4) -fprofile-arcs -ftest-coverage : It’s showing shared library errors.
I have one question.
1) Have configured “GCOV” library in MCUExpresso IDE.
– If Yes then : where you should linked this tool.
LikeLike
can you please have a look at my project for the K64 I have referenced in this article? I’m not sure what you mean with “1) Have configured “GCOV” library in MCUExpresso IDE”: there is nothing needed.
LikeLike
Hello Erich
Successfully configured all project properties settings.
Now Also generating “*.gcda” file but while calling “gcov_write();” from “main” source file getting below error :
libgcov profiling error:/home/harsiddh/Documents/MCUXpresso_11.4.0_6224/workspace/evkmimxrt1170_mipi_dsi_compliant_test_cm7/Debug/board/pin_mux.gcda:overwriting an existing profile data with a different timestamp
Can you help me out for this.
LikeLike
See https://stackoverflow.com/questions/68136230/gcda-file-coverage-info-not-getting-updated-when-two-executables-run-for-same-s
LikeLike
I have already go through this stackoverflow blog for above error issue.
But , How can I apply same thing in “mcuexpresso”.
Means which settings are required in “mcuexpresso” for overcome this error.
LikeLike
It is not a setting, it is how you use it. You cannot add coverage information to a file which has different checksums because you have compiled it multiple times.
LikeLike
Pingback: Tutorial: GNU gcov Coverage with the NXP i.MX RT1064 | MCU on Eclipse
Hi,
If i tried to build with command line using command “mcuxpressoide -nosplash -application org.eclipse.cdt.managedbuilder.core.headlessbuild -data $WORKSPACE –launcher.suppressErrors -cleanBuild all” with setting –coverage & -fprofile-arcs in c/c++ debugging & in linker. but build size less as compare to manual building through MCUXpresso IDE. also build is not proper using command line building.
is there anything i need to add in command line building?
LikeLiked by 1 person
have you checked the used command line?
LikeLike
Hi,
Thanks for reply…
but where i have to set this option? in IDE?
command :- mcuxpressoide -nosplash -application org.eclipse.cdt.managedbuilder.core.headlessbuild -data $WORKSPACE –launcher.suppressErrors -cleanBuild all
LikeLiked by 1 person
For the build in the IDE itself, you can check the command line output in the console. For the build through the command line of the IDE not sure how to get it, but you might add a prebuild or postbuild script to output the environment. My thinking is that a different toolchain is used for each build, resulting in the difference. Or that different options are used somehow.
LikeLike