In my “Tutorial: Catching Rogue Memory Accesses with Eclipse and GDB Watchpoints” I have used Eclipse/CDT and GDB watchpoints. I used a conditional watchpoint, but this comes with a performance hit. In this article I show how to use the ARM Cortex trace hardware to catch specific writes to a memory location. Without severe performance degradation. But for this I need a little helper: the DEADBEEF catcher!

0xdeadbeef catcher
Outline
Compared to the previous article (Tutorial: Catching Rogue Memory Accesses with Eclipse and GDB Watchpoints), I going beyond the normal watchpoint usage. I’m going to use dedicated plugins and views in the free-of-charge Eclipse based NXP MCUXpresso IDE 10.2.1. As board I’m using the NXP FRDM-K64F with an external NXP LPC-Link debug probe attached to it (see “Custom 3D Printed Enclosure for NXP LPC-Link2 Debug Probes“).
Be aware that not every ARM Cortex-M device implements the capabilities used in this article. I’m using instruction trace with watchpoint triggers which do need the ARM MTB (Micro Trace Buffer) implemented, which can be augmented with the ARM ETM (Embedded Trace Macrocell).
This uses a trace buffer in RAM which can be configured as ring buffer. On the plus side I don’t need any dedicated trace pins or expensive debug probes: I can use normal debug probes which are able to read/write the memory on the device.
That’s why I can use for example the NXP OpenSDA with Segger J-Link, P&E Multilink or the NXP LPC-Link2 too:
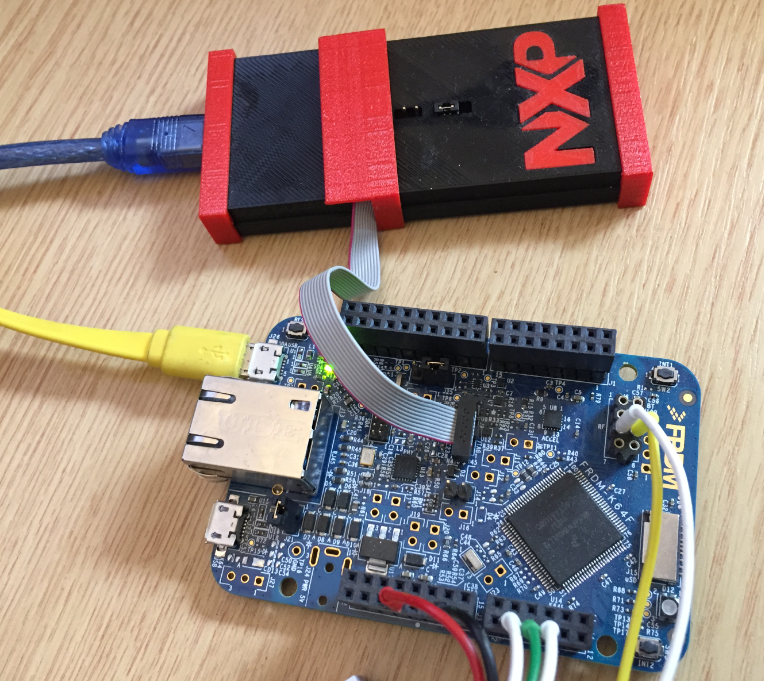
FRDM-K64F with LPC-Link2 Debug Probe
The needed trace configuration and knowledge is in the debugger and IDE. That way I have special views for configuration and trace viewing available in the NXP MCUXpresso IDE.
💡 It would be possible to configure the trace and watchpoint hardware with GDB commands/scripting or directly in the application, but this would be beyond this article.
For further information, have a read at the provided IDE documentation:

MCUXpresso IDE Instruction Trace Guide
Test Code
As in previous article, I’m going to use the following function as a test case emulating a rogue access to memory.
static uint32_t testVar;
static void bar(void) {
	for(counter=0; counter<5000000; counter++) {
		testVar++;
		if (counter==134566) { /* emulating something else corrupting my testVar */
			PRINTF("catch me...");
			testVar = 0xdeadbeef; /* outsch! */
			PRINTF("if you can!");
		}
		__asm("nop"); /* just doing something */
	}
}
What I want to catch with the debugger is a write to ‘testVar’ with a value of ‘0xdeadbeef’.
Getting Started
💡 Note that the views used below are the ones from the NXP MCUXpresso IDE 10.2.1 and are not available in other Eclipse distributions.
First, open the Instruction trace Config view:
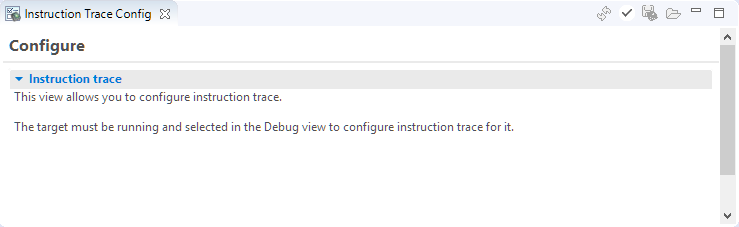
Instruction Trace Config View
You can open that view from the IDE Window > Show View menu:
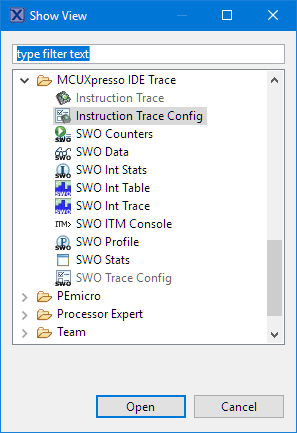
MCUXpression IDE Trace
As noted in the view, I need a working debug connection to the board, so make sure that you start a debug session, and have it halted/suspended. Then the view should look like this:
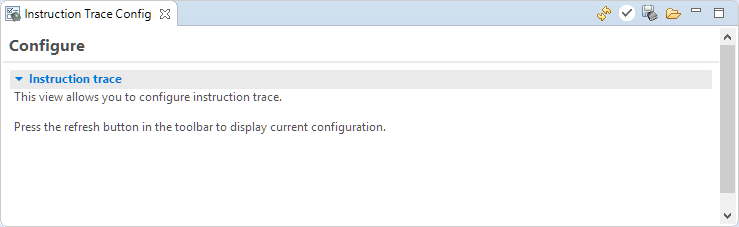
Instruction Trace ready to refresh from target
Configuring Trace and Triggers
With the connection to the target, use the Refresh button:
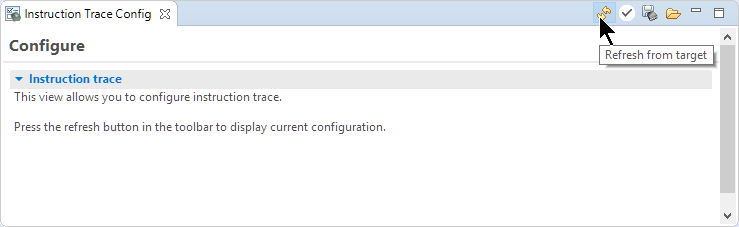
Refresh from Target
This loads the current settings from the target:
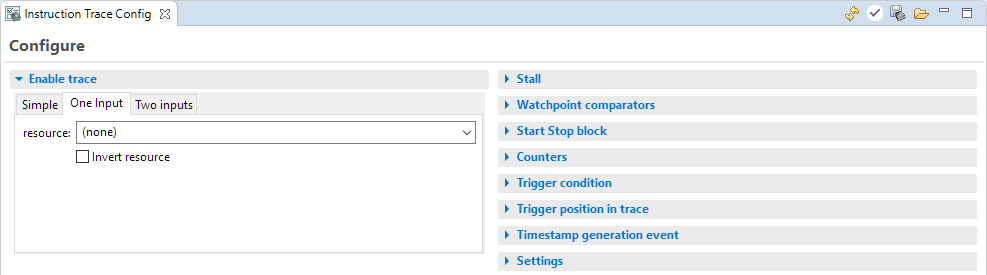
Loaded Trace Configuration from Target
Next, inside ‘Enable trace’ tab, make sure that trace is enabled:
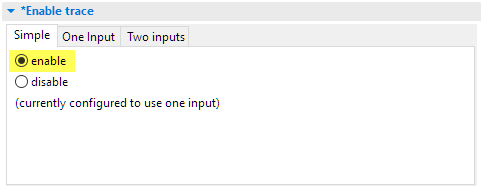
Trace enable
💡 Keep that tab in the foreground/visible, as this defines the setting!
Next, we want to stall the ETM on the processor if the FIFO buffer is getting full. Below I have configured it with 14 free bytes free, it shall stall the processor:
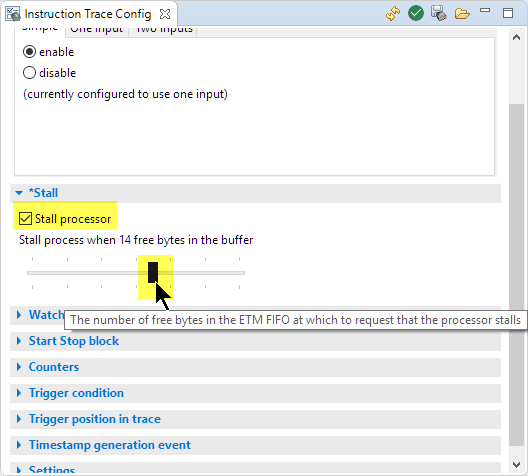
Stall Setting
Next, I’m going to create the trigger event, if something writes to my variable in question. In my case I see that my variable is located at 0x2000’001c:
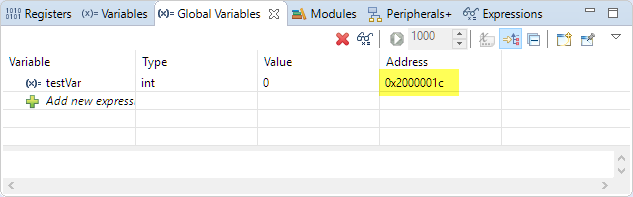
Address of variable
I click on ‘Request’ button to get a comparator. I configure it for ‘Data Write’ at the address 0x2000001c. The mask is optional: with this I catch an address range.
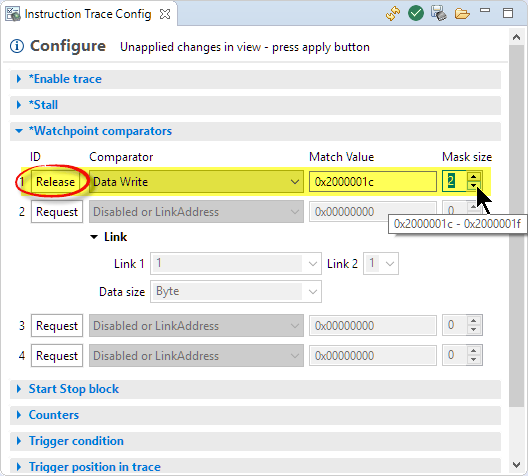
Data Write Configuration
This would trigger for any writes to that address (range). I’m interested if a piece of code writes the 0xdeadbeef pattern. So I’m going to add this as for the second comparator:
I use a second comparator with ‘Data Value Write’ and the data pattern as match value. I have it linked back to my address (data write) comparator ID 1 (for both links) to build a linked/combined comparator. Don’t forget to specify the data size (Word or 32bits in my case):
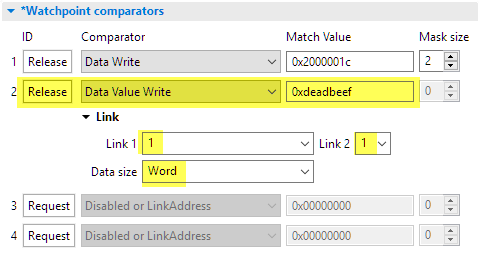
Second Comparator Settings
Now I have to specify what shall happen if the comparator triggers. Switch the ‘Trigger condition’ to the tab with ‘One Input’. I’m using only one input to the condition, so I specify that comparator ID 2 (which is linked to ID 1) I have set up in one of the previous step:

Trigger Condition Input
💡 Keep that tab in the foreground/visible, as this defines the setting!
Next I’m going to configure how many words are written to the buffer after the trigger fires to get some context around the trigger event. I have configured it for 50 words below so I still have 462 words in the trace buffer to see where the code is coming from:
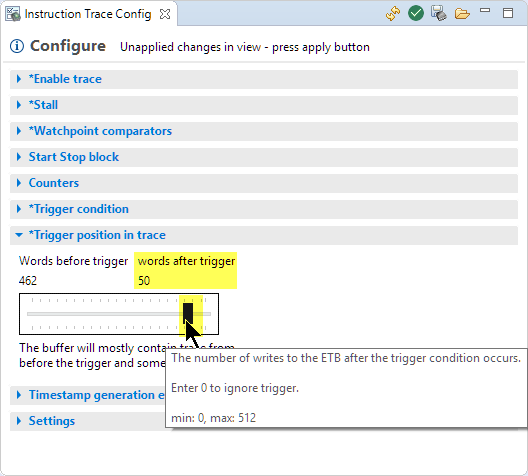
Words after trigger
As the last setting, I want that the trigger raises a debug request. This will stop the debugger and I can inspect what happened:
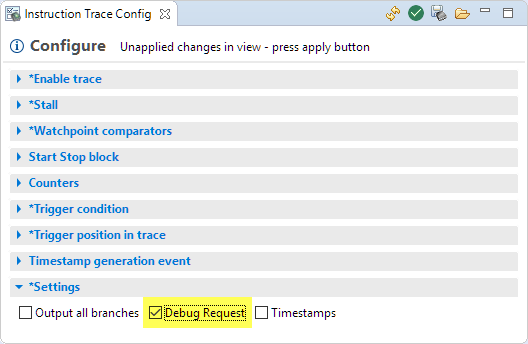
Debug Request
Finally, use the green checkmark icon to store the settings on the target:
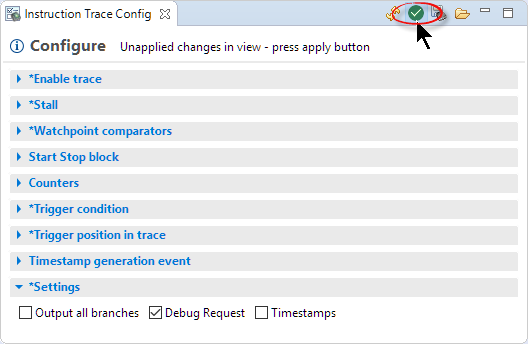
Store the Settings on Target
This configures the trace and trigger registers on the microcontroller With the settings stored, the green button will turn ‘grey’:

Settings stored
Additionally, that toolbar has save and restore buttons to save my precious configuration in a text/XML file (default is etmConfig.xml) on the disk.
💡 If the view does not show the loaded values (I had this in 10.2.1) after loading from the XML file: close the Instruction Trace Config view and re-open it again. Change a value (e.g. disable trace) and store it on the target, then enable trace again and store it again on the target with the green button. You still have to enable the comparators. Make sure you cross-check the values in the settings.
In summary, below is my configuration with all the settings:
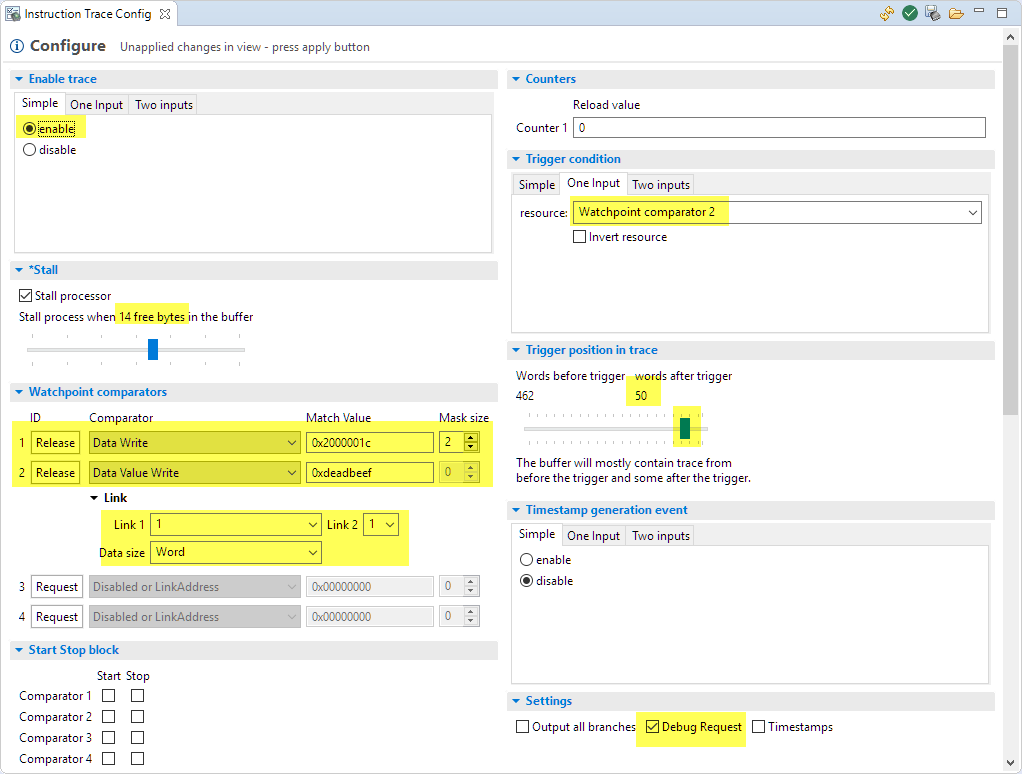
Configuration Settings
Catching it
Continue running the application with the debugger. If the trigger condition gets true, be aware that the debugger will halt the running application with a screeching stop:
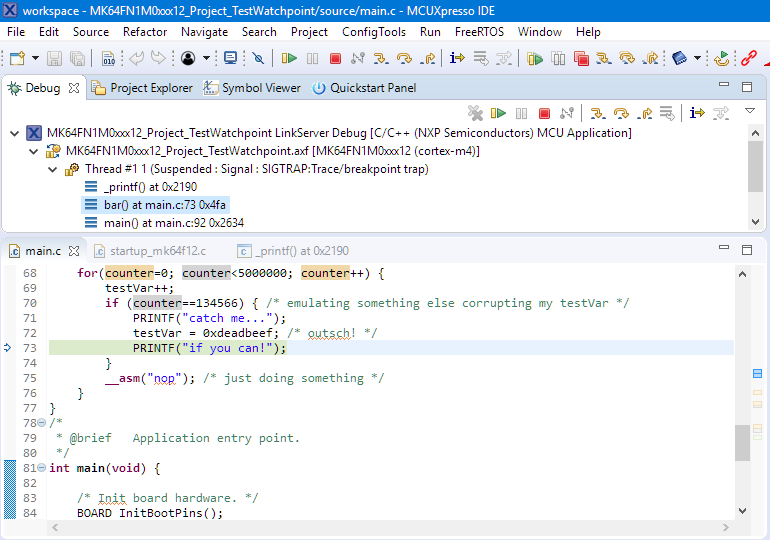
Stopped target after watchpoint triggered
💡 As explained in “Tutorial: Catching Rogue Memory Accesses with Eclipse and GDB Watchpoints“, there will be some jitter and the target will stop a few instructions after the event, so you have to go back a few lines of code. In my application above the target finally came to a stop while executing instructions inside _printf().
Excellent: we have found the place! But it does not stop here as we are using trace, so we have recorded the instructions leading to this memory corruption. Let’s have a look…
Instruction Trace
For this open the Instruction Trace view (if not open already):
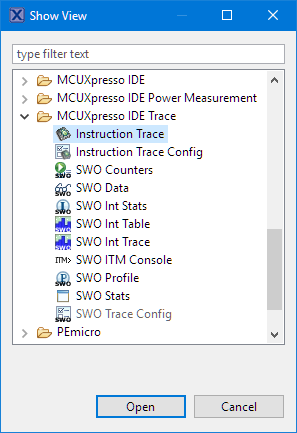
Instruction Trace
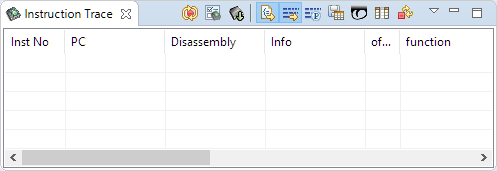
Empty instruction trace view
Press the button in the toolbar of that view to get the data from the target (ETB content):

Getting trace from target
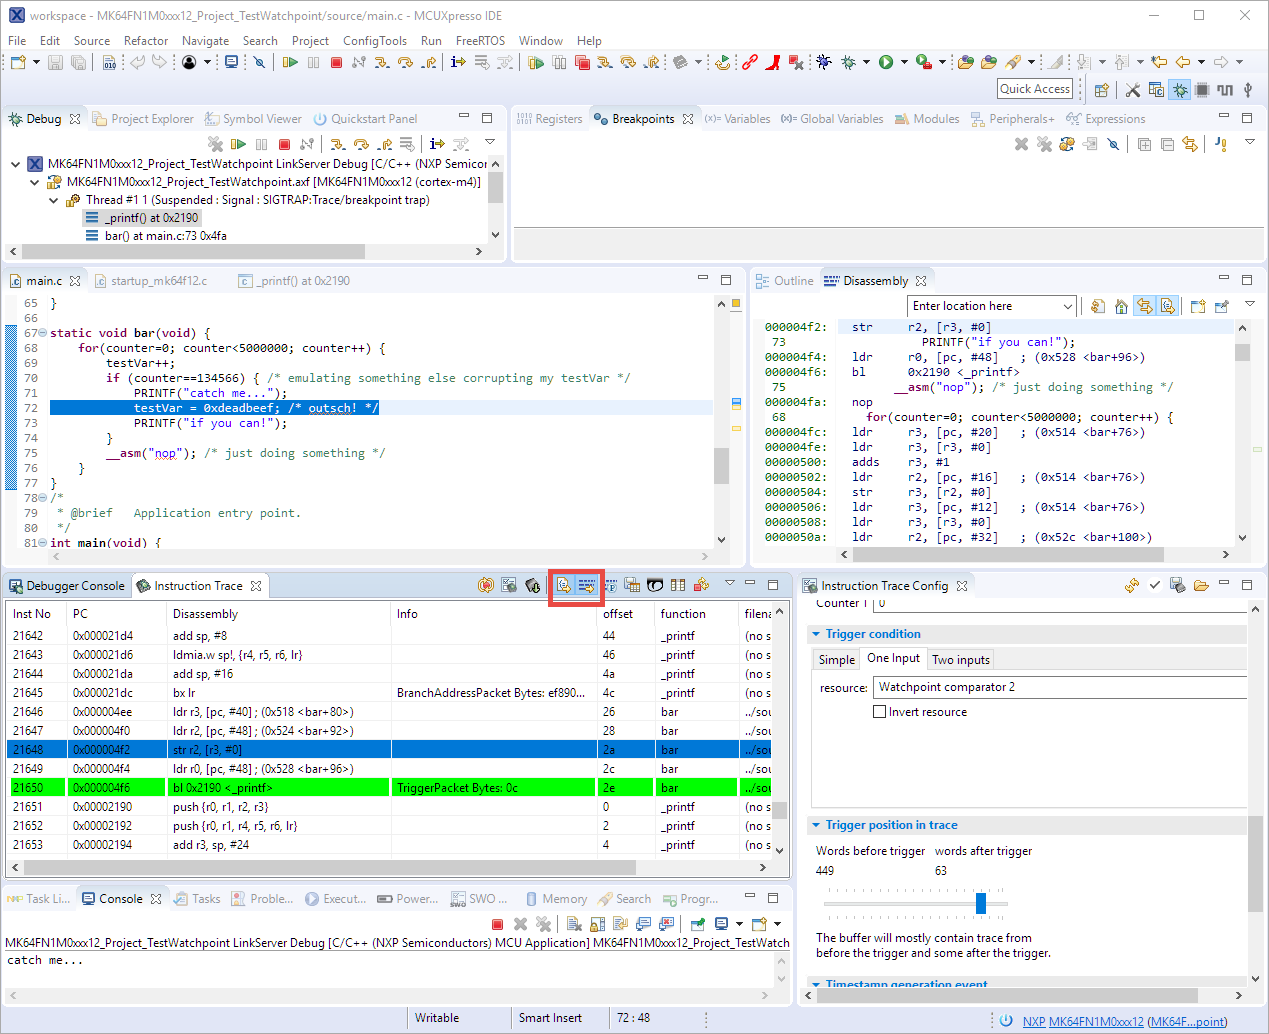
The toolbar has an icon which I can use to jump to the trigger packet:
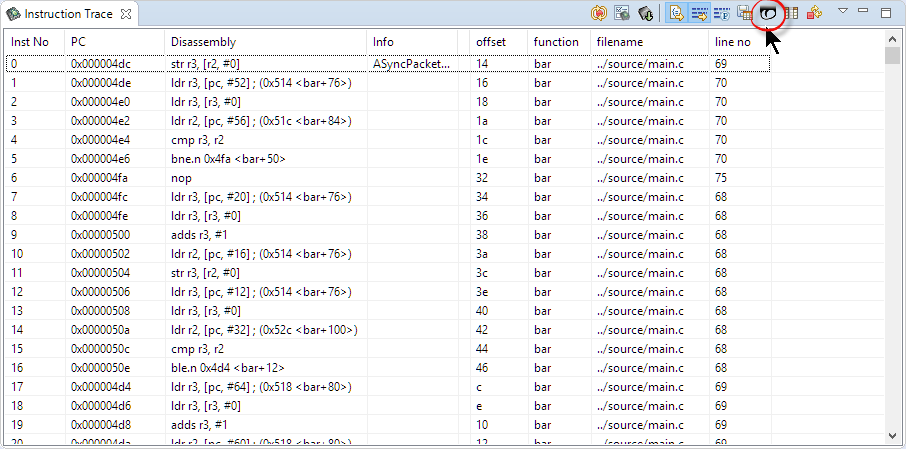
Find First Trigger Packet
That way the offending instruction is easily identifiable:

Offending instruction
The view has two buttons which sync with the source and disassembly view: that way I can go through the trace sequence and having the source for it (if available) synced:
Sync Trace with Source and Disassembly
Now with knowing that location changing my memory location, all what I need to do now is to fix the bug behind it 🙂
Summary
Watchpoints with gdb are good, but hardware watchpoint triggers are better. But they are not easily accessible and might be complicated to setup. Using the MCUXpresso IDE helps, because it provides a convenient access to the ARM MTB/ITM hardware. That way I can configure a watchstop trigger and as an extra benefit I get instruction trace :-). I hope you find this tutorial useful.
Happy DeadBeef’ing 🙂

Thanks, Erich! I was able to replicate your test setup and caught a write of a test value to a specific variable. I tried using that on my ongoing FreeRTOS problem and it didn’t seem to catch a write of 0 to pxCurrentTCB, though it shows up as 0 in the memory view after the usage fault. I’m assuming the CPU can ‘skid’ past the comparator match by a few instructions?
In any case I was able to get some trace information this last time I caught it, so I’ll be picking through that to see what I can find.
LikeLike
Hi Scott,
yes, in my cases there was always some skid for the hardware to come to a full stop. I think if that access causes a usage fault, that probaly gets priority and fired before the trigger can act on it.
LikeLike
It is “easy” when you have a debugger attached, but what if you can’t? I made a post about runtime watchpoints, so that rouge memory accesses can be caught by the firmware itself to assist in debugging. You can read it here: https://lb9mg.no/2018/08/25/cortex-m-debugging-runtime-memory-corruption/
LikeLiked by 1 person
Thanks for providing that link to this article: indeed, the application itself can use that hardware functionality.
What I do with on debugger attached and if it stops on certain condition/error, I can attach to it with the debugger and then inspect the target state, for example with the J-Link: https://mcuoneclipse.com/2015/03/20/attaching-to-a-running-target-with-segger-j-link-gdb-and-eclipse/
LikeLike
Hey @LB9MG I have been going through your article and tying to implement it locally on my pc.
I get ton of errors as some header includes and declerations are missing. Can you please direct me to the complete code base.
LikeLike
Hi Erich, good article!
I wish to know if it is possible to catch the condition where a (global) variable is written with any value, but only when another (global) variable has a specific value (0).
LikeLike
Hi,
I’ve made some tests and I think that the concept to operate according to my needs can be:
– When the second variable is written with 0, trace starts
– When the second variable is written with a value other than 0, trace stops
– When the first variable is written with any value, a trigger event occurs
How must I configure the instruction trace to work such a way?
Many thanks
Biafra
LikeLike
Hi Biafra,
I have not used it fro that particlular case, but with linking the trace triggers you should be able to do this.
LikeLike
Hi Erich,
This configuration can’t be used because of the only 4 watchpoint comparators available are not enough.
I’m trying to use another solution:
I’ve configured the DWT peripheral to set the debug monitor interrupt, but I have two problems:
– Every time I write the variable, the program stops if there is the debug probe connected (P&E multilink universal), whether if it’s running a debug session or a release session
– The interrupt is never executed (whether the debug probe is connected or not)
This is the code I use:
unsigned long DebugVar = 0;
unsigned long DebugHandler = 0;
void main( void )
{
unsigned long DebugCnt = 0;
…
//init debugmon
CoreDebug->DEMCR = CoreDebug_DEMCR_TRCENA_Msk |
CoreDebug_DEMCR_MON_EN_Msk;
DWT->COMP0 = ( uint32_t )&DebugVar;
DWT->MASK0 = 0;
DWT->FUNCTION0 = ( 1 << 11 ) | ( 1 << 2 ) | ( 1 <= 100 ) //every 10 s
{
DebugCnt = 0;
DebugVar++; //write var
}
…
if( DebugHandler )
{
//debug
PRINTF( “Debug monitor handler executed\n” );
DebugHandler = 0;
}
vTaskDelay( 10 ); //systick = 10 ms: delay 100 ms
}
}
void DebugMon_Handler( void )
{
if( DWT->FUNCTION0 & DWT_FUNCTION_MATCHED_Msk )
DebugHandler = 1;
}
Is there any error? Why is the interrupt never executed? Is it possible to avoid stopping the execution during the debug session?
Many thanks
Biafra
LikeLike
Sorry Erich, there is an error in the code. This is the corect one:
unsigned long DebugVar = 0;
unsigned long DebugHandler = 0;
void main( void )
{
unsigned long DebugCnt = 0;
…
//init debugmon
CoreDebug->DEMCR = CoreDebug_DEMCR_TRCENA_Msk |
CoreDebug_DEMCR_MON_EN_Msk;
DWT->COMP0 = ( uint32_t )&DebugVar;
DWT->MASK0 = 0;
DWT->FUNCTION0 = ( 1 << 11 ) | ( 1 << 2 ) | ( 1 <= 100 ) //every 10 s
{
DebugCnt = 0;
DebugVar++; //write var
}
…
if( DebugHandler )
{
//debug
PRINTF( “Debug monitor handler executed\n” );
DebugHandler = 0;
}
vTaskDelay( 10 ); //systick = 10 ms: delay 100 ms
}
}
void DebugMon_Handler( void )
{
if( DWT->FUNCTION0 & DWT_FUNCTION_MATCHED_Msk )
DebugHandler = 1;
}
Many thanks
Biafra
LikeLike
It seems that the posting process is wrong. The init is:
//init debugmon
CoreDebug->DEMCR = CoreDebug_DEMCR_TRCENA_Msk |
CoreDebug_DEMCR_MON_EN_Msk;
DWT->COMP0 = ( uint32_t )&DebugVar;
DWT->MASK0 = 0;
DWT->FUNCTION0 = ( 1 << 11 ) | ( 1 << 2 ) | ( 1 << 0 );
NVIC_SetPriority( DebugMonitor_IRQn, 7 );
EnableIRQ( DebugMonitor_IRQn );
LikeLike
Then there is:
while( 1 )
{
if( DebugCnt++ >= 100 ) //every 10 s
{
DebugCnt = 0;
DebugVar++; //write var
}
…
if( DebugHandler )
{
//debug
PRINTF( “Debug monitor handler executed\n” );
DebugHandler = 0;
}
vTaskDelay( 10 ); //systick = 10 ms: delay 100 ms
}
LikeLike
Now it is correct. When I pasted the whole code a part was lost, maybe because of the post length.
Many thanks
Biafra
LikeLike
Hello Biafra,
Can you please share your code including the headers and other includes. I am trying to run similar code to yours from http://m0agx.eu/2018/08/25/cortex-m-debugging-runtime-memory-corruption/ but i get errors.
If you can provide your code may be I can compare them and use it.
thanks you!
Bharadwaj.
LikeLike
Hi bharadwajk3,
I’m sorry, but I haven’t that code anymore, it was a test.
Have a nice day
Biafra
LikeLike
HI Erich Styger,Great article!
whare can i find the code for this article??
I see other users have also posted some code snippets,where can i find complete code?
LikeLike