
Eclipse is great: it gives me the tools and capabilities to solve the really hard bugs to find. An example of that ‘hard’ category are ‘rogue’ memory accesses: something in the application is accessing an unwanted memory location and corrupts the data. This might be very sporadic, or takes a long while until it happens. With normal ‘stop-mode’ debugging (setting a normal breakpoint) and stepping usually won’t let me find that bug, as it might be coming from a pointer somewhere. Maybe from an interrupt routine. Or maybe an unitialized or corrupted pointer corrupts to my memory. Usually all what I know is the memory adddress of the data, maybe what is written, but not what or who is writing to that location.
In this article I’m using one of the ‘less-known’ debugging techniques available in Eclipse and CDT and how it works: watchpoints!

Watchpoint with Condition
In this article I’m using one of the ‘less-known’ debugging techniques available in Eclipse and CDT and how it works: watchpoints!
Outline
In this tutorial I show how to use the debugger with Eclipse/CDT to detect unwanted writes to variables or memory. For this I’m using the NXP MCUXpresso IDE 10.2.1, but pretty much this applies to any other Eclipse with CDT. Eclipse is not really great exposing the watchpoint functionality, so this article should help you getting started.
Watchpoints: read/write access
Watchpoints are a kind of ‘breakpoint on data’. It is assumed that the data is a global variable and not a variable on the stack.
In the first case I’m going to find out what is writing on a variable or memory location. For this I’m going to use the following emulation example: The idea is to stop the debugger when a write access happens to that variable:
static int testVar;
static void foo(void) {
	testVar = 1234; /* init */
	for(counter=0; counter<5000000; counter++) {
		if (counter==77832) { /* emulating something else corrupting my testVar */
			PRINTF("catch me...");
			testVar = 0; /* outsch! */
			PRINTF("if you can!");
		}
		__asm("nop"); /* just doing something */
	}
}
The easiest way to set a watchpoint is to use the Eclipse Outline view (see “Watchpoints: Data Breakpoints“):

Toggle Watchpoint
I configure it as a write watchpoint, so it stops the debugger when a write to that variable or memory address happens:

Write Watchpoint
If I run that application out of reset, it will stop the debugger in three places:
- During startup initialization (zero-out)
- Initialization of the variable with 1234
- The simulated ‘rogue’ write with 0

Watchpoint triggered
You might notice that the debugger stopped inside the printf() call. This because usually depending on the hardware there is some delay or jitter until the hardware comes to a full stop. This really depends on the hardware and how the debugger implements the watchpoint with the debug probe and hardware, but usually it sets up a kind of hardware trigger with ‘please raise a debug event if the data bus sees an access to that given address’. As usually this is handled in the microcontroller itself, this does not really affect the runtime behaviour of the application.
Watchpoint: Conditional Watchpoint
In the previous example the watchpoint triggered on any write access, so it triggered as well for the cases which were ‘ok’. But what we want to capture is that write with 0:
testVar = 0;
For this we could set the watchpoint with a condition like this:

Write Watchpoint with a Condition
Running our example again, it will only trigger and stop the debugger if a write access happens with zero.
The ‘Ignore count’ can be used as a ‘count-down’ until it triggers, for example I can catch the 3rd time when the access and condition is true.
Watchpoint with Range
It is possible to specify a Range:
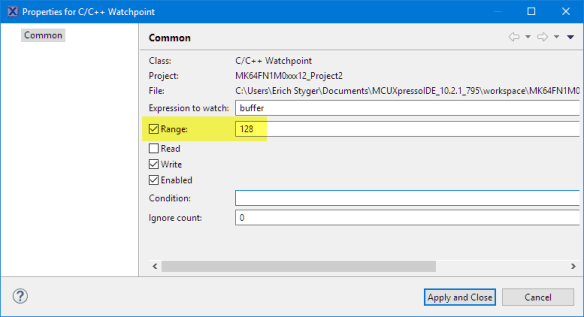
Watchpoint with Range
This will catch any write accesses to my buffer:
uint8_t buffer[128];
💡 Note that the range feature did not work well with early versions of Eclipse IDE’s and CDT.
Breakpoints View
The watchpoints are listed in the Breakpoint view as other breakpoints. I can disable and delete watchpoints, but I cannot otherwise modify it. What I do is to delete and re-create it if I need to change it.

Watchpoint in Breakpoint View
Debugger Console
You can check and see this as well in the Debugger Console View:

Debugger Console
In that console you can check with
show can-use-hw-watchpoints
if the debugger is using hardware for watchpoints. Or use
info breakpoint
to get information about the current breakpoints (and watchpoints):

GDB Breakpoint info
Performance Impact
So far so good. In my example there were not many access to that memory location where I had the watchpoint on it.
Lets assume a different use case where I’m changing that variable a lot and still want to catch that variable write with a condition (and just for fun with a different constant 🙂 ):
static void bar(void) {
	for(counter=0; counter<5000000; counter++) {
		testVar++;
		if (counter==134566) { /* emulating something else corrupting my testVar */
			PRINTF("catch me...");
			testVar = 0xdeadbeef; /* outsch! */
			PRINTF("if you can!");
		}
		__asm("nop"); /* just doing something */
	}
}
Now you will notice that this is running really slow, up to the point that GDB might throw an internal error and give up 😦
src/gdb/gdb/infrun.c:2379: internal-error: void resume(gdb_signal): Assertion `!tp->stop_requested' failed.
A problem internal to GDB has been detected,
further debugging may prove unreliable.
Create a core file of GDB? (y or n) [answered Y; input not from terminal]
So what basically happens with conditional watchpoints (and breakpoints with conditions too) is that GDB stops, then evaluates the condition and if it is FALSE continues to run. This all takes time.
Summary
Watchpoints in Eclipse/CDT are somewhat hidden, but greatly help to detect read/write accesses to memory. Conditions are possible, but with the general way how they are implemented it makes code execution slower, especially with lots of accesses. Depending on your hardware it *would* be possible to set some hardware trigger with comparator and simple condition evaluation. But given the diversity of such hardware implementation and the fact that not many users seems to use watchpoints anyway, this is rarely supported, or rather complicated to setup. So using GDB watchpoints with hardware is great for read/write access, but adding a condition to the watchpoint usually comes with some costs.
In a next article I’ll show how use instruction trace on ARM Cortex-M3/M4/M7 to catch rogue memory acesses. With using the hardware, I can solve the ‘normal’ watchpoint performance problem with condition.
Happy Watching 🙂

Hello Erich,
This is a amazing trick! In the IAR compiler there is a similar feature, it’s called ‘live watch’, differently of ‘normal’ watch the ‘live watch’ update the variable in real time, however in Eclipse I didn’t found a similar feature, but with watchpointer the things become more easy!
Great work!
LikeLike
thanks 🙂
Such a ‘live watch’ variable monitoring unfortuntely is not provided in a standard way in Eclipse. It exists in multiple different implementation, e.g. for CodeWarrior, Kinetis Design Studio or MCUXpresso IDE.
If you google for ‘mcuoneclipse live variable’ you will find several articles on that topic, for example:
or see ‘variable graphing’ in https://mcuoneclipse.com/2018/05/20/overview-of-mcuxpresso-ide-v10-2-0/
or for example with the P&E debug connection: https://mcuoneclipse.com/2017/02/25/pe-arm-cortex-m-debugging-with-freertos-thread-awareness-and-real-time-expressions-for-gdb-and-eclipse/
Enjoy 🙂
LikeLike
I see you’re testing my favorite hexadecimal value: 0xDEADBEEF. A very tasty article. Thanks 🙂
LikeLike
Jim,
I do have more for you which I use frequently:
0xDEADCELL0xDEADC0DE0xDEADBABE0xBAAAAAAD0xBAADF00Dand another of my favorite is
0xCAFEBABEenjoy 🙂
LikeLike
Pingback: Tutorial: Catching Rogue Memory Accesses with ARM Watchpoint Comparators and Instruction Trace | MCU on Eclipse