Sometimes my embedded application is not doing what I want it to do. I can solve many problems with normal ‘step/stop mode debugging‘: setting breakpoints, step, stop, inspect data, and so on. But not always. If a piece of code is changing a global variable unintentionally, I do not know where to set my breakpoint. Something is changing my variable, and I have no clue from where. It could be a dangling pointer, a stack overflow or something similar which I cannot track down with code breakpoints. What I need is a breakpoint on data: watchpoints!
To my surprise, especially junior developers are not aware of the powerful watchpoint capabilities offered by modern microcontrollers. Too many times I have see engineers debugging a memory or dangling pointer problem without considering watchpoints to solve the problem. To their defense: what the silicon designers put into the silicon is sometimes not easy to use neither, and varies from one microcontroller to another. But basic watchpoint support is what is needed the most time. And luckily this is supported in eclipse and CodeWarrrior.
Watchpoints are ‘data breakpoints’: instead breaking/stopping the application on an instruction, it allows to stop the CPU on a memory access. The number and capabilities of watchpoints depend on the microcontroller used. Most vendors offer a few watchpoints, and even a single one can save me many hours of debugging. Typically I can set it up to trigger either on read or write access, or both. The hardware implements this typically with an address comparator: if there is a match of the address on the bus, then the CPU gets stopped, or whatever I configure it to do.
Watchpoint on Variables
With this I can solve the “who I accessing or writing my variable or memory?” problem. Adding a watchpoint on a variable is really easy in Eclipse and CodeWarrior: In the Variables view I use the context menu to add a new watchpoint:
This gives me the following dialog where I can configure the settings:
I can use the variable name, or any other expression which is evaluated to a memory address. Typically it is a global variable or memory address. Setting a watchpoint on a local/stack variable is probably not what I want.
Depending on my hardware capabilities and memory architecture, I can specify the memory space (e.g. code space or data space).
Watchpoint on Memory
In a similar way I can create a watchpoint on memory in the Memory View (see Memory is everything):
Watchpoints are (Data) Breakpoints
As watchpoints are indeed data breakpoints, they show up in the normal Breakpoint View:
I can enable/disable the watchpoint like any other breakpoint, but unfortunately eclipse does not allow me to change the expression (well, that is one of my wishes for the next release). But at least I can change the other properties. For this, I use the Breakpoint Propteries context menu on the watchpoint:
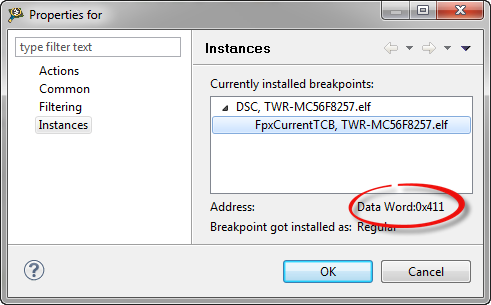
With the following dialog I can change the properties:
The same dialog reveals as well the address in memory monitored:
Stopping on a Watchpoint
With my watchpoint set up, I let the program run. If my code now accesses that watchpoint address, it stops the debugger:
In the Debug view I can see that the reason for the stop was a watchpoint, and in the source view I can see what line of code was causing this.
Summary
Watchpoints (also known as ‘data breakpoints’) are an important debugging feature for me to chase down many hard problems. They saved me a lot of debugging time. As watchpoints are a function of the hardware, the eclipse support for it is still kind of minimalistic. But it serves the most common needs: stopping the debugger on a read/write access to a given address. And this is usually all what I need.
Happy watching 🙂


Pingback: USB CDC goes medical | MCU on Eclipse
Pingback: Review of CodeWarrior for MCU10.4 | MCU on Eclipse
Pingback: C/C++ Watchpoints with Eclipse Kepler | MCU on Eclipse
Hi Erich,
The data watchpoints are pretty handy, except for two problems that I can think of –
1) finding how to set them is really non-intuitive. you should be able to right-click on the variable to get the watchpoint menu.
2) they don’t seem to be realtime. I’m running realtime control and when I add a watchpoint to break if I write to a value, my whole system hiccups on every access of that value, instead of ideally only stopping on a write and not affecting operation on a read.
Brynn
LikeLike
about 1) I 100% agree, that’s why I wrote that article.
about 2) this depends on the debug probe and the amount of available hardware breakpoints for this. The debug probe should use the hardware trigger functions (as available).
What core are you using?
LikeLike
I am using the Segger J-link and it’s a K22FN512 running at 120Mhz
The single data watchpoint is the only ‘breakpoint’ set, because I know only a few breakpoints fit in the hardware at one time.
So the K22FN512 makes it a M4 core with floating point?
LikeLike
Yes, the Kinetis K22FN512 has a FPU.
LikeLike
Pingback: Tutorial: Catching Rogue Memory Accesses with Eclipse and GDB Watchpoints | MCU on Eclipse