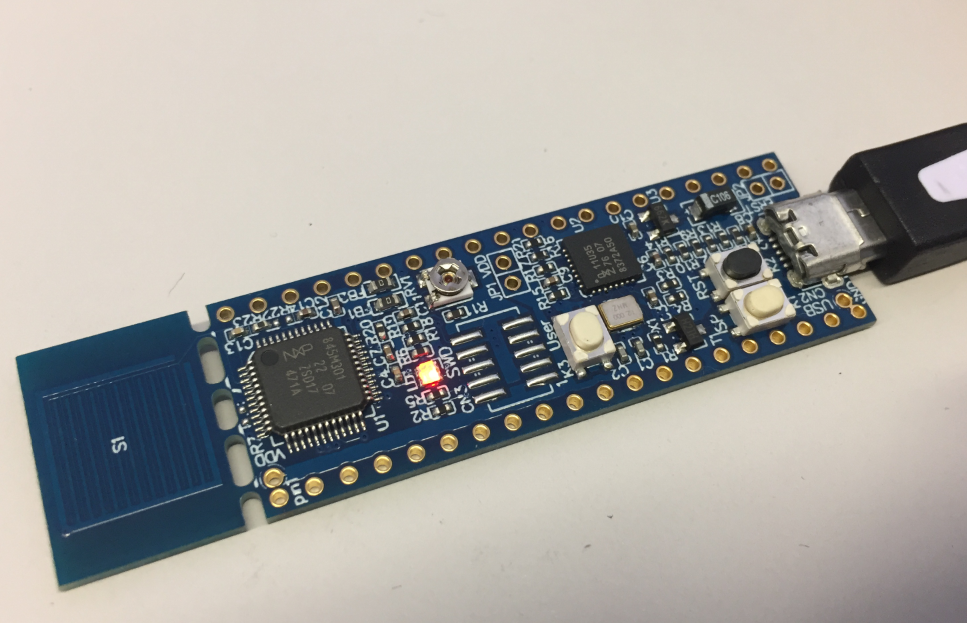
Using the debugger to inspect the application data is a very convenient thing. But if the data grows and if the data set is large, it makes more sense to dump the data to the host and process it offline. GDB is the de-facto debugger engine and includes a powerful command line and scripting engine which can be used in Eclipse too.
Tag Archives: memory
Tutorial: Catching Rogue Memory Accesses with Eclipse and GDB Watchpoints
Eclipse is great: it gives me the tools and capabilities to solve the really hard bugs to find. An example of that ‘hard’ category are ‘rogue’ memory accesses: something in the application is accessing an unwanted memory location and corrupts the data. This might be very sporadic, or takes a long while until it happens. With normal ‘stop-mode’ debugging (setting a normal breakpoint) and stepping usually won’t let me find that bug, as it might be coming from a pointer somewhere. Maybe from an interrupt routine. Or maybe an unitialized or corrupted pointer corrupts to my memory. Usually all what I know is the memory adddress of the data, maybe what is written, but not what or who is writing to that location.
In this article I’m using one of the ‘less-known’ debugging techniques available in Eclipse and CDT and how it works: watchpoints!
Using Multiple Memory Regions with the FreeRTOS Heap
ARM Cortex-M microcontrollers can have multiple memory controllers. This is a good thing as it allows the hardware to do multiple parallel memory read/writes. However this makes the memory map more complicated for the software: it divides the memory into different regions and memory segments. This article is about how to enable FreeRTOS to use multiple memory blocks for a virtual combined memory heap: