Using the debugger to inspect the application data is a very convenient thing. But if the data grows and if the data set is large, it makes more sense to dump the data to the host and process it offline. GDB is the de-facto debugger engine and includes a powerful command line and scripting engine which can be used in Eclipse too.
GDB Debugger Console
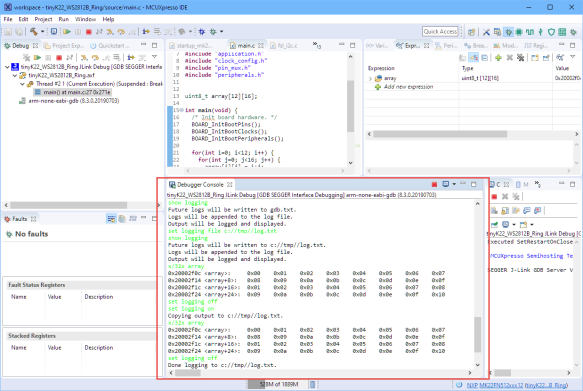
The GDB console can be used in the gdb command line application, or in Eclipse using the Debugger Console view:
GDB ‘dump’ command
With the gdb ‘dump’ command I can write a memory range or an expression to a file:
dump [format] memory filename start_addr end_addr
dump [format] value filename expr
Different formats are supported, with ‘binary’, ‘ihex’ and ‘srec’ the most obvious ones.
For example if I want to dump the variable ‘array’ as S-Record, I can use the following:
dump srec value c:\\tmp\\dump.srec array
The ‘append’ command works the same way, except that it appends to a file:
append [binary] memory filename start_addr end_addr
append [binary] value filename expr
GDB ‘x’ Command
GDB has the ‘x’ or examine command to inspect memory.
To redirect the output to a file, I specify a log file and enable logging:
set logging file c://tmp//log.txt
set logging on
To dump the first 32 bytes of the array in hex format I can use the following:
x/32x array
which gives:
0x20002f0c <array>:	0x00	0x01	0x02	0x03	0x04	0x05	0x06	0x07
0x20002f14 <array+8>:	0x08	0x09	0x0a	0x0b	0x0c	0x0d	0x0e	0x0f
0x20002f1c <array+16>:	0x01	0x02	0x03	0x04	0x05	0x06	0x07	0x08
0x20002f24 <array+24>:	0x09	0x0a	0x0b	0x0c	0x0d	0x0e	0x0f	0x10
Using ‘x’ I have to specify the number of bytes.
At the end, turn logging off:
set logging off
GDB ‘print’ command
With the ‘print’ command I can print any expression.
To redirect the output to a file:
set logging file c://tmp//log.txt
set logging on
To print an array in hexadecimal I can use:
print /x array
This produces something like this:
$4 = {{0x0, 0x1, 0x2, 0x3, 0x4, 0x5, 0x6, 0x7, 0x8, 0x9, 0xa, 0xb, 0xc, 0xd, 0xe, 0xf}, {0x1, 0x2, 0x3, 0x4, 0x5, 0x6, 0x7, 0x8, 0x9, 0xa, 0xb, 0xc, 0xd, 0xe, 0xf, 0x10}, {0x2, 0x3, 0x4, 0x5, 0x6, 0x7, 0x8, 0x9, 0xa, 0xb, 0xc, 0xd, 0xe, 0xf, 0x10, 0x11}, {0x3, 0x4, 0x5, 0x6, 0x7, 0x8, 0x9, 0xa, 0xb, 0xc, 0xd, 0xe, 0xf, 0x10, 0x11, 0x12}, {0x4, 0x5, 0x6, 0x7, 0x8, 0x9, 0xa, 0xb, 0xc, 0xd, 0xe, 0xf, 0x10, 0x11, 0x12, 0x13}, {0x5, 0x6, 0x7, 0x8, 0x9, 0xa, 0xb, 0xc, 0xd, 0xe, 0xf, 0x10, 0x11, 0x12, 0x13, 0x14}, {0x6, 0x7, 0x8, 0x9, 0xa, 0xb, 0xc, 0xd, 0xe, 0xf, 0x10, 0x11, 0x12, 0x13, 0x14, 0x15}, {0x7, 0x8, 0x9, 0xa, 0xb, 0xc, 0xd, 0xe, 0xf, 0x10, 0x11, 0x12, 0x13, 0x14, 0x15, 0x16}, {0x8, 0x9, 0xa, 0xb, 0xc, 0xd, 0xe, 0xf, 0x10, 0x11, 0x12, 0x13, 0x14, 0x15, 0x16, 0x17}, {0x9, 0xa, 0xb, 0xc, 0xd, 0xe, 0xf, 0x10, 0x11, 0x12, 0x13, 0x14, 0x15, 0x16, 0x17, 0x18}, {0xa, 0xb, 0xc, 0xd, 0xe, 0xf, 0x10, 0x11, 0x12, 0x13, 0x14, 0x15, 0x16, 0x17, 0x18, 0x19}, {0xb, 0xc, 0xd, 0xe, 0xf, 0x10, 0x11, 0x12, 0x13, 0x14, 0x15, 0x16, 0x17, 0x18, 0x19, 0x1a}}
At the end, turn logging off:
set logging off
Summary
There are many ways with GDB to dump data, memory or expressions. Modern gdb includes a Python, so you could use scripts for even more advanced things (see links section below).
Happy dumping 🙂
Links
- How to dump data with gdb for GnuPlot: https://mcuoneclipse.com/2020/02/09/visualizing-data-with-eclipse-gdb-and-gnuplot/
- Dumping data with CodeWarrior andn Eclipse: https://mcuoneclipse.com/2012/05/04/dump-my-device-memory/
- GDB dump command: https://sourceware.org/gdb/current/onlinedocs/gdb/Dump_002fRestore-Files.html
- GDB x command: https://sourceware.org/gdb/current/onlinedocs/gdb/Memory.html
- Stackoverflow: formatted memory dumps: https://stackoverflow.com/questions/9233095/memory-dump-formatted-like-xxd-from-gdb
- GDB Logging: https://sourceware.org/gdb/current/onlinedocs/gdb/Logging-Output.html
- GDB print: https://sourceware.org/gdb/current/onlinedocs/gdb/Output-Formats.html


