Questions from students or readers of my articles are a great source for all kind of articles. And here is the ‘question of this week’: “What is realtime debugging”?
It’s a good question because the topic of ‘realtime’ and ‘debugging’ was a topic in the lectures this week. So this question gives me the opportunity to combine the two things of ‘realtime’ and ‘debugging’, I love it :-).

Debugging Setup
Overview
Debugging is probably the part in the development where the most time is spent, for many reasons. It is that part of the development process which usually can be planned the least. If you are looking for an overview about different debugging techniques, or if you are wondering what ‘Realtime Debugging’ means, then I hope this article is useful for you.
‘Realtime debugging’ has two parts:
- debugging
- realtime
Both terms deserve a deep-dive :-).
What is ‘debugging’?
I’m still amazed how many students are not familiar with the concept and benefits of ‘debugging’. Debugging is defined by Wikipedia as:
“Debugging is the process of finding and resolving of defects that prevent correct operation of computer software or a system.”
And indeed it can be something like finding and removing a moth from a relay :-):

first actual case of bug being found (Source: https://en.wikipedia.org/wiki/Debugging)
If the system is correct and operates correctly, then no debugging is needed. But how many systems are known as correct in all cases? At least the software written by me is rarely correct the first time, so I’m using a ‘debugger’ to inspect the system to find ‘ bugs’ in order to correct the system.
There are many ways to ‘debug’ and inspect the system:
- LED Blinking: I could use a LED and watch the blinking to see if the system is operating correctly. I could use that LED in my code to show the status of the system, and based on the LED blinking I would gain knowledge about what is going on. That certainly works for very simply and slow computer systems.
Toggle LED
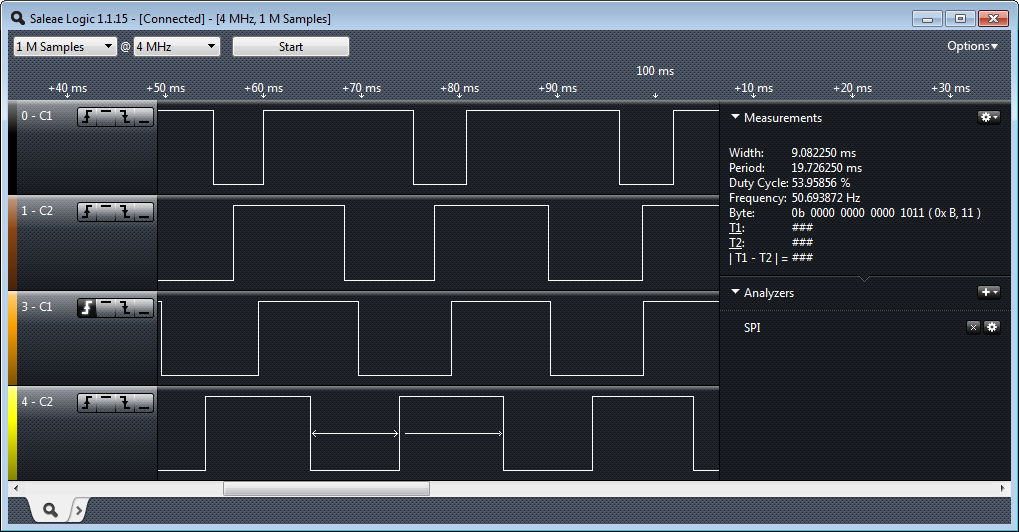
- Pin Toggling: For faster systems, I could record the LED or microcontroller pin with an oscilloscope or logic analyzer. That allows me to inspect faster signals. And I can pack more information into the signal by say sending a variable content in a binary format, or using multiple pins/signals:

Quadrature Signals in Logic Analyzer
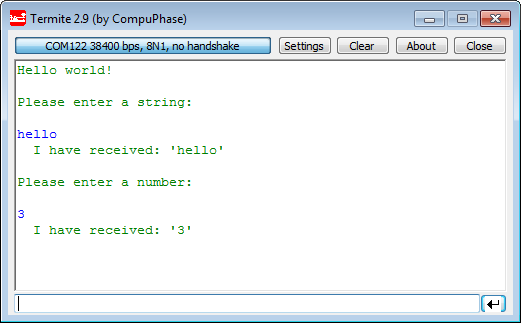
- Printf Debugging: I can issue more information by using a communication channel from the system, say sending and receiving text using a UART or USB connection. This is what I refer as ‘printf debugging’: using sending and receiving text I can inspect the target system and get visibility into its behaviour:

printf() and scanf() in action
- Stop-Mode Debugging: The above approaches inspect a system which is constantly running. Another approach to halt the target so I can inspect it. That way I can inspect multiple things, and when I’m finished, I let the system running again. This is what I refer as ‘stop-mode debugging’. For this the hardware/microcontroller needs a special hardware built-in which allows to halt the system for inspection. A commonly used technology for this is JTAG (or SWD on ARM cores which is similar, but with less pin numbers). Typical debug probes in the ARM Cortex world are the P&E Multilink or the Segger J-Link. This usually needs some special hardware ‘debug probes’ like a JTAG or SWD device which is connected to the JTAG/SWD pins of the microcontroller. Another approach without using something like JTAG/SWD is ‘monitor based debugging’: with this a small ‘monitor’ program is running on the target to which I can send commands. That ‘monitor’ program then will allow me to stop/step/etc the program. For both the ‘monitor’ or ‘JTAG’ way, I need some kind of ‘controller’ program on the host. With that special software on a host computer (a ‘debugger’) I have a tool to start or stop execution, step through my code, inspect the variables and code running on the target system.That program can be a command line tool (like command line gdb, see “Command Line Programming and Debugging with GDB“) or I can use a graphical program like Eclipse or programs like the SEGGER Ozone debugger (see “First Steps with Ozone and the Segger J-Link Trace Pro“):

ozone-debugger
Combination of GDB Debugging Probes and Boards
- Software Trace: Sometimes the ‘stop-mode’ debugging is not enough. Because stopping the system might change the system behaviour or stopping might not be possible (e.g. I cannot stop an engine in a care while I’m driving on the highway). For this techniques like ‘tracing’ are used. Tracing means that the device under test constantly sends (‘streams’) debugging information to the attached host system, without stopping it. Streaming can be purely software based (see “Tutorial: FreeMASTER Visualization and Run-Time Debugging“) or using features of the running operating system (see “FreeRTOS Continuous Trace Streaming“). Plus there is the SEGGER J-Scope for this purpose:

j-scope
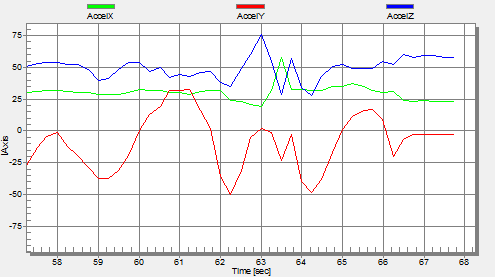
Accelerometer Graph with FreeMASTER
- Hardware Trace: Because a ‘software’ streaming might affect the behaviour of the running software, a ‘hardware trace’ solution has to use dedicated (and sometimes expensive) hardware and requires a more expert understanding of the system (see “Tutorial: Getting ETM Instruction Trace with NXP Kinetis ARM Cortex-M4F“).

tracing-cortex-m4-with-j-trace
- Live Variable Debugging: ‘Stop mode debugging’ allows me to step or stop the target. But many times I want to see how things are changing over time. With ‘live variables’ the normal ‘stop-mode-debugger’ is extended with the ability to send/receive data while the target is ‘running’. An example of this is described in “P&E ARM Cortex-M Debugging with FreeRTOS Thread Awareness and Real Time Expressions for GDB and Eclipse“.
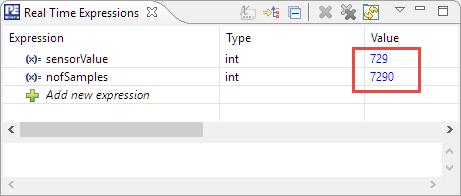
Realtime Expressions View


All the above debugging techniques have an impact on the device under debug, which is commonly referred as ‘intrusiveness’. Debugging might be more or less intrusive or disruptive for the device under test. For example using stop-mode-debugging means bringing the system to a full stop which might affect other systems around the system under debug (think about halting the engine in a car while driving). Or using printf() style debugging will affect the resource usage and timing of the system, because the device-under-test needs time to put out all the needed data. Because debugging might impact the timing of the system, we have a closer look to the ‘time’ aspect.
What is ‘realtime’?
The term ‘realtime’ is used in many ways (see Wikipedia). ‘Realtime’ is an attribute of a system. In the context of embedded systems or computer systems, a ‘realtime system’ can be defined as
- Correctness: The correct result
- Timeliness: At the correct time
- Independent of current system load
- In a deterministic and foreseeable way
Point 1 and point 2 are the most important ones. Point 3 and point 4 are a logical consequence of the first two points. The definition is more around system theory, but for our question of ‘realtime debugging’ the debugger or the device under test (with the debugger attached to it) is ‘the system’.
Condition 1 (The correct result) is simple: if the system does not provide the correct result, the system is not correct and fails. What is ‘correct’ needs to be defined for the particular system. For example for the clock in “Making-Of Sea Shell Sand Clock” the clock shall write the correct time:
Condition 2 (At the correct time) means that the correct result (from point 1) needs to be delivered at the specified time or within the specified time frame. ‘Realtime’ does not mean ‘as fast as possible’: it means: ‘at the correct time’, which includes ‘within the correct timing boundaries’, either relative or absolute.
There are two ‘flavours’ of realtime: hard realtime and soft realtime. For hard realtime the system has to meet the condition 2 in 100% of the time, otherwise the system is not considered as correct. For example a hard realtime airbag system has to deploy the airbag in 100% of all cases, it is *not* ok that the airbag sometimes is deployed a too early, too late or not deployed at all (you certainly would not use such a system, right?). In a soft realtime system it is fine that the system sometimes violates the ‘correct time’ condition, such as a video streaming system could delay some frames or miss sending a few of them. The system is still considered as ‘correct’ (you still would use the system to watch a video), but the system would be considered as ‘degraded’ or as ‘not so good’. For the sand clock project shown above, the time needs to be written every minute. It is a soft realtime system as it would be ok (but not good) if the time would be written several seconds too late.
Condition 3 (Independent of current system load) is a logical result of the previous two points for computer systems. A computer or microcontroller can only do one single thing at a time. However, the computer system is attached to the ‘real world’ in which we are living, and in this real world things are happening in parallel. For a computer system, dealing with that ‘real’ world means that the computer system has to divide its processing time to multiple things (‘multi-tasking’). This condition basically means that the regardless how many things the computer system is doing, it needs to meet the timing and correctness conditions. Condition 3 is used as a ‘helper’ condition to qualify and quantify the scenarios under which the correct result has to be delivered at the correct time. For the example of the sand clock: it is runs an operating system on a tinyK20, and it can communicate over USB to the outside world, while it is constantly checking the internal realtime clock. Regardless what the system is doing, it has to meet the ‘correct result at the correct time’ condition.

tinyk20 mounted inside clock
Condition 4 (In a deterministic and foreseeable way) is yet another supporting condition to meet conditions 1 to 3. It basically means that for every given state of the system it is determined what the next state of the system will be. For every given state, it is foreseeable and defined what will come in the very next state. Or in other words: the system is not behaving in a random way. This supporting condition ensures that the system can be fully described and proven in a ‘mathematical’ way to be correct and to meet the timing conditions.
‘Realtime’ + ‘Debugging’ = ‘Realtime Debugging’?
Combining ‘Realtime’ with ‘Debugging’, this means that the debugger enables me to inspect and debug a to verify the device realtime capabilities, under ‘realtime conditions’:
- Correctness: I can use the debugger to verify the correctness of the device: inspect the device internal status, inspect its internal and external signals and states.
- Timeliness: Debugging gives me visibility into the concurrent or ‘quasi-concurrent’ events on the system. I can verify the timing and timing boundaries of the firmware and device under test. I can inspect the absolute and relative timing of the system. It gives me information how the device timing relates to the real world time and timing.
- Independent of current system load: The debugging allows me to verify and see the system load of the device under debug. Using the debugger does not impact the timeliness or behaviour of the device, or is very small.
- In a deterministic and foreseeable way: The debugger can be used to verify the determinism of the device, and does not affect the determinism of the device. For example the debugger does not read registers which could cause a side effect. The impact of the debugger to the target is well-defined. I have control over what happens with the debugger and how it affects the target.
Or in other words: beside of the target correctness verification, the debugger needs to be able to correlate the system/device timing and behavior with the ‘real world’ timing or the ‘realtime’.
Most realtime systems have timing boundaries in the milliseconds or few microsecond areas. Such timing is definitely not able to be handled with pure software based or ‘printf()’ style debugging, as that method is simply to slow and is not able to keep up with a high resolution timing. So I do not consider that ‘printf()’ style debugging suitable for realtime debugging. ‘Pin Toggling’ and ‘LED blinking’ can be used to some extend with an external hardware probe (oscilloscope/logic analyzer) capturing and measuring the signal, but the amount of data is very limited.
Usually, systems are much more complex. On a high level, I can use software tracing tools like Segger SystemView which gives visibility into the system and interrupt timing. With this, I can correlate the system timing and behaviour to the ‘real time’:

Nested Interrupts in Segger SystemView
Another tool for this is the Percepio FreeRTOS+Trace which records RTOS and application events: I can see how things are working quasi-parallel, with a timing down to the micro seconds:

Percepio FreeRTOS+Trace Main Window
To get such an exact timing from the system, usually the device hardware itself provides some kind of time stamping (e.g. using a cycle count register, see “Cycle Counting on ARM Cortex-M with DWT“).
The other challenge is to get the data off the system in a timely manner. For this, typically dedicated hardware and probes using JTAG/SWD are necessary.

JTAG Header
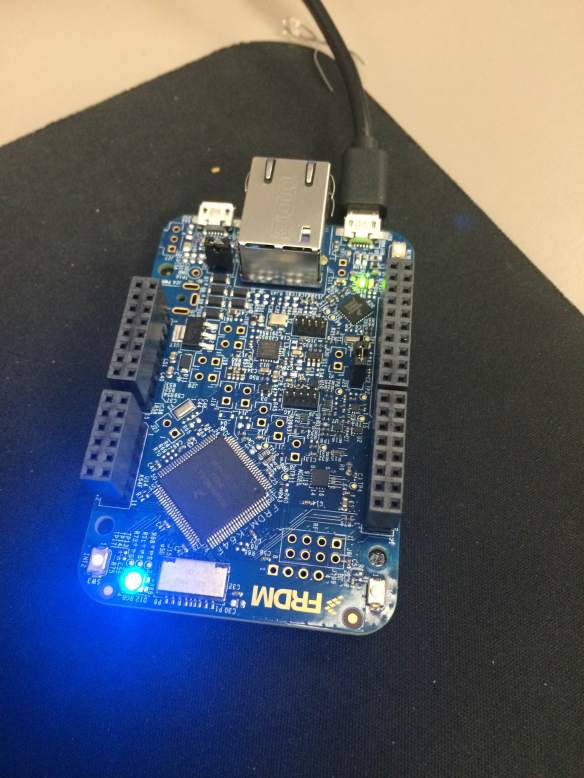
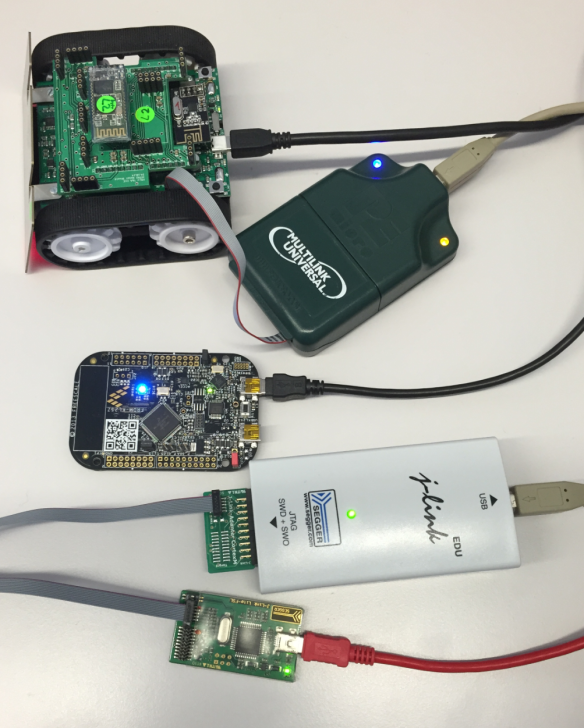
With a hardware JTAG/SWD debug probe the debugger can take over the device under debug, with no or minimal/defined impact on the timeliness of the target:
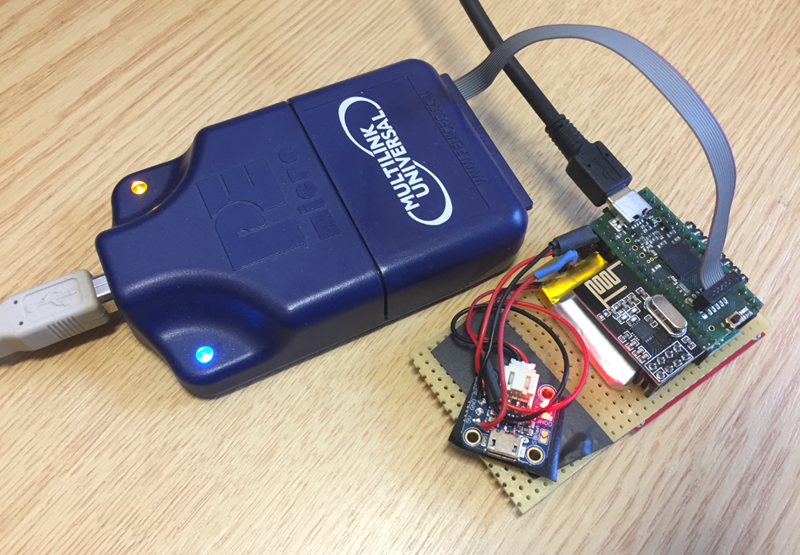
P&E Multilink Universal debugging a board
Using such a JTAG/SWD debug probe, I can use the debugger to control the device under debug in ‘stop-mode’:
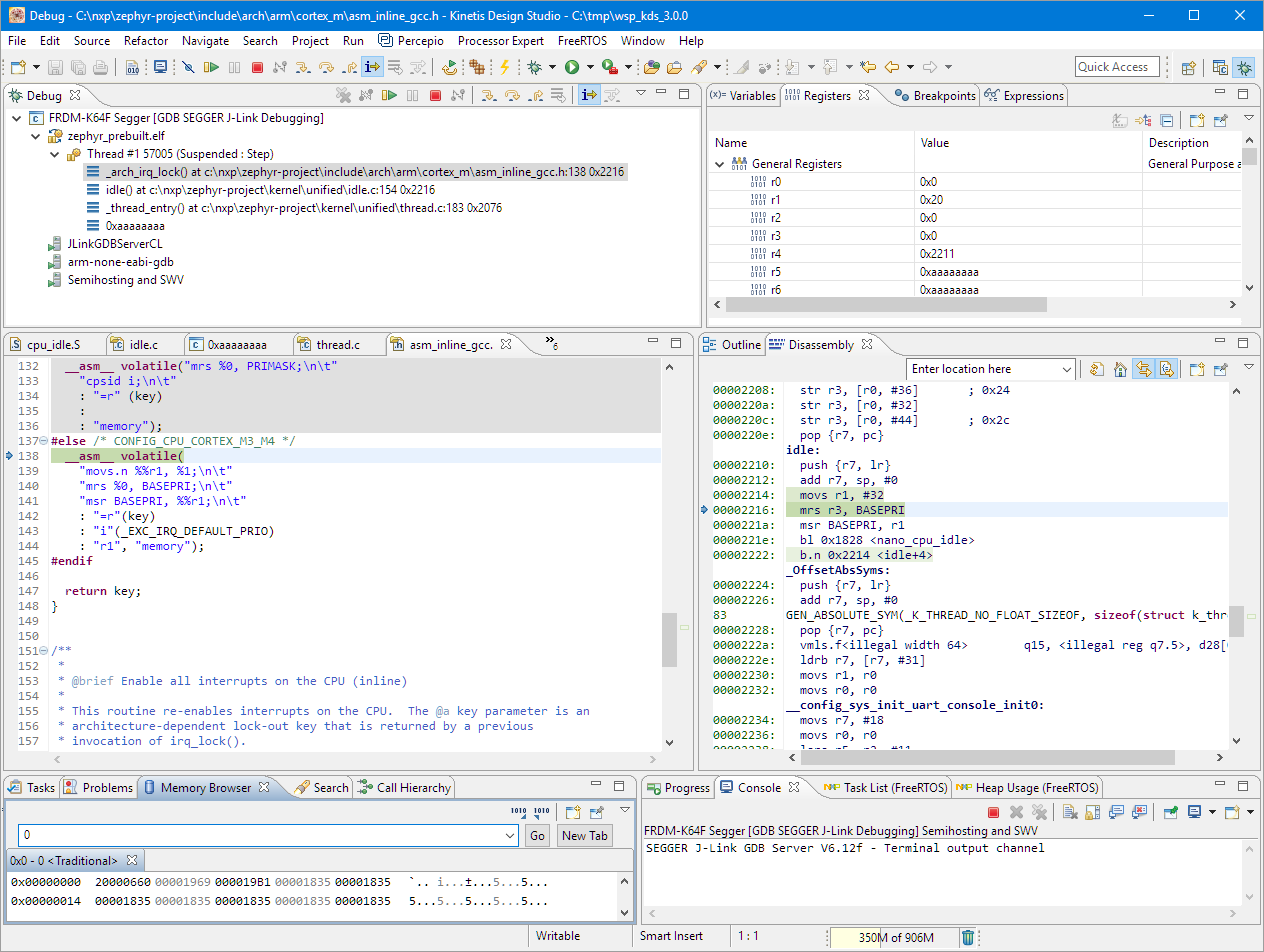
Graphical Debugging Zephyr with Eclipse and GDB
If I need to record and inspect the target while it is running, then I need things like ‘live view’ which allows me to see variables and expressions changing:

Variable Live View
And to solve the hard problems and to get the most visibility, I need to do full instruction and data access tracing, using dedicated trace hardware and tools:

instruction-trace
Summary
In essence, ‘realtime debugging’ means be able to debug and inspect a device which is supposed to be realtime. For this, I need to closely map the device behaviour and execution to the ‘real world time’. For most systems, a ‘printf()’ style debugging will not be enough, as too slow and too intrusive: it affects the system behaviour too much. If I have to map the system device timing to the micro- and nanoseconds, I need something different.
For most debugging, I need deep control over the device under debug, which usually requires debugging using JTAG/SWD/SWO pins for stop-mode debugging. The next level is to use instruction and data tracing: this gives the most and best visibility into the system and its timing, but requires dedicated tracing hardware and tools.
I’m using a combination of different debugging technologies: A mix of SWD/JTAG stop-mode debugging with software/hardware tracing.
What is your experience, and what works best for you?
Happy Realtiming 🙂

I was hoping you would mention the ability to display the value of any application variable as a X-Y graph plotted against time, and show a screen capture. In the past, I’ve used FreeMaster for this. However, it’s lack of ongoing development forces me to look for more modern alternatives that have more capability.
LikeLike
Hi Dave,
Many thanks, good point. I had mentioned FreeMASTER, but not added a screenshot. I have added this now to the article too, and divided the trace into software and hardware trace. I have the same feeling about FreeMASTER, and that’s why I’m using the SEGGER J-Scope (https://www.segger.com/j-link-j-scope.html) as an alternative. But (as FreeMASTER) this is on Windows only, so Linux and Mac users cannot take advantage of it.
Thanks again!
Erich
LikeLike
I don’t think I agree with you on the “deterministic” criterion. There are many applications for stochastic real-time systems (such as all gambling devices), in which “deterministic and forseeable” are not desirable criteria. There are more complicated constraints (such as bounds on the distribution) that replace determinism.
LikeLiked by 1 person
I was hoping for such a question :-). Such a stochastic function still would fullfil the critera as it can be described as “in the next state, the system will produce a true random number in the range of 0x0 to 0xff, and that number fill be even distributed.” or something similar.
LikeLike
A “manual ping-back” on a tracing technique people reading this blog might also find useful (it’s applicable to a wide range of environments, especially when a hardware debugger might be not available): https://lowerstrata.net/post/serial-tracing/
LikeLike
Thanks for that link, indeed, that technique is interesting too!
LikeLiked by 1 person
Very intresting article. Today I intresting in question of Processor In Loop modeling for SRM motor control system. I try to use STM32F407 for this purpose. And also I need electric motor simulator for this real microcontroller. I suppose, that I don’t need real time debbuging in the full sense of the word, but I only need to clock the motor simulator and STM32 from the same clock (I want to use Simulink or another soft to do motor model and hand-made analog i/o-modules). OK, but what will be if I whant to halt processor (… and motor simulator) or to set breakpoint – I don’t know. Can I use SWD clock for cloking external device (motor simulator or another processor)? Can you ansver me?
LikeLike
No, I don’t think you can use the SWD clock for this: this clock is used by the debugger to communicate with the debug block on the ARM core.
LikeLike