
Some ARM Cortex-M have a DWT (Data Watchpoint and Trace) unit implemented, and it has a nice feature in that unit which counts the execution cycles. The DWT is usually implemented on most Cortex-M3, M4 and M7 devices, including e.g. the NXP Kinetis or LPC devices.
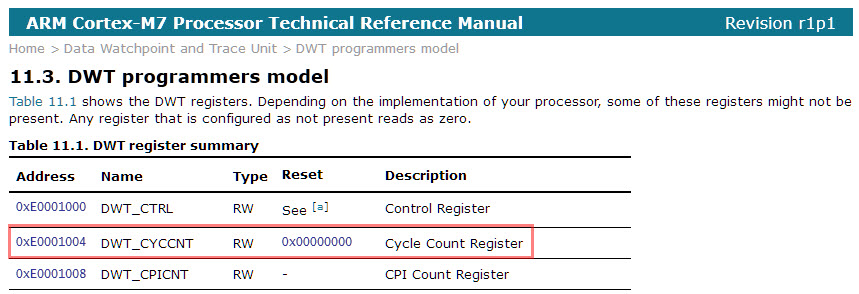
DWT Cycle Count Register (Source: http://infocenter.arm.com/help/index.jsp?topic=/com.arm.doc.ddi0489d/BABJFFGJ.html)
Outline
Execution profiling tools like the SEGGER SystemView are using it to measure the time used for code execution. This post is about how to use it directly from the application code or to enable cycle counting and inspect it during debugging.
Registers and Access Functions
The DWT is usually implemented in Cortex-M3 or higher, but not on Cortex-M0(+). To use the feature, I need to have access to several debug registers. You might use CMSIS-Core header files for this, but as there are very few registers in case CMSIS-Core is not used, here are the needed defines I’m going to use:
  /* DWT (Data Watchpoint and Trace) registers, only exists on ARM Cortex with a DWT unit */
  #define KIN1_DWT_CONTROL             (*((volatile uint32_t*)0xE0001000))
    /*!< DWT Control register */
  #define KIN1_DWT_CYCCNTENA_BIT       (1UL<<0)
    /*!< CYCCNTENA bit in DWT_CONTROL register */
  #define KIN1_DWT_CYCCNT              (*((volatile uint32_t*)0xE0001004))
    /*!< DWT Cycle Counter register */
  #define KIN1_DEMCR                   (*((volatile uint32_t*)0xE000EDFC))
    /*!< DEMCR: Debug Exception and Monitor Control Register */
  #define KIN1_TRCENA_BIT              (1UL<<24)
    /*!< Trace enable bit in DEMCR register */
To use the registers, I have defined a set of ‘function like’ macros I can use in my application code:
#define KIN1_InitCycleCounter() \
  KIN1_DEMCR |= KIN1_TRCENA_BIT
  /*!< TRCENA: Enable trace and debug block DEMCR (Debug Exception and Monitor Control Register */

#define KIN1_ResetCycleCounter() \
  KIN1_DWT_CYCCNT = 0
  /*!< Reset cycle counter */

#define KIN1_EnableCycleCounter() \
  KIN1_DWT_CONTROL |= KIN1_DWT_CYCCNTENA_BIT
  /*!< Enable cycle counter */

#define KIN1_DisableCycleCounter() \
  KIN1_DWT_CONTROL &= ~KIN1_DWT_CYCCNTENA_BIT
  /*!< Disable cycle counter */

#define KIN1_GetCycleCounter() \
  KIN1_DWT_CYCCNT
  /*!< Read cycle counter register */
Typical Usage
To use the cycle counting feature, the DWT has to be configured and enabled. If you are connecting to the target with a debugger, then this is usually already enabled by the debugger. To make it work with no debug session active, I have to initialize it in the code first.
uint32_t cycles; /* number of cycles */

KIN1_InitCycleCounter(); /* enable DWT hardware */
KIN1_ResetCycleCounter(); /* reset cycle counter */
KIN1_EnableCycleCounter(); /* start counting */
foo(); /* call function and count cycles */
cycles = KIN1_GetCycleCounter(); /* get cycle counter */
KIN1_DisableCycleCounter(); /* disable counting if not used any more */
Cycle Counter with Debugger
To monitor the cycle counter during a debug session is easy: add the following expression tothe ‘Expressions’ view:
(*((volatile uint32_t*)0xE0001004))
With this, it shows the current cycle counter:
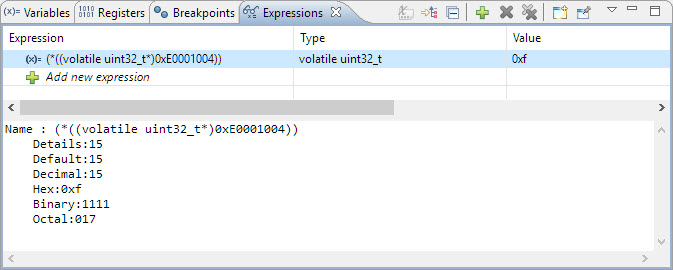
Cycle Counter in Expressions View
Processor Expert Component
To make it even easier to use, I have extended the KinetisTools component with the needed macros and functions. This component will be available with the next release:

Cycle Counting Functions
Summary
If your ARM Cortex-M has a DWT, you can use the cycle counter to measure the cycles spent executing code. That could be used for delay loops or to measure execution time.
Happy Cycling 🙂
Links
- DEMCR register: http://infocenter.arm.com/help/index.jsp?topic=/com.arm.doc.ddi0337e/CEGHJDCF.html
- DWT Registers: http://infocenter.arm.com/help/index.jsp?topic=/com.arm.doc.ddi0439b/BABJFFGJ.html
- DWT Control Register: http://infocenter.arm.com/help/index.jsp?topic=/com.arm.doc.ddi0337e/ch11s05s01.html

I just used your delay component code in a baremetal a while ago, I was wondering how you came up with the timings… Now this is neat! Good job!
LikeLike
Thanks :-). Only keep in mind that this does not exist on the ARMv6 (e.g. Cortex-M0).
LikeLike
Ugh. Well, better that I see it here, than spend 15 to 20 more minutes looking for it. I’m working with an LPC832, based on the M0, and I didn’t see the DWT registers in the Registers view. This saves me a few minutes.
LikeLike
Hi Aaron,
yes, for cost reasons (reduced silicon size), ARM had decided to strip down features for the Cortex-M0(+). And one of the many features removed was the DWT.
Erich
LikeLiked by 1 person
Hi Erich,
Just what I was looking for! Well, I think. I need a high speed time stamp mechanism (+/-50uS roughly or better) to measure several event times in an application and I found your discussion here from a Google search (I read your stuff almost daily). I am trying to determine timing relationships between an incoming GPIO signal (which generates an interrupt) compared to inbound/outbound serial data. I wrote a logging function to log this information which I can dump and inspect. via a command line interface. I need to implement this across four K64F targets.
My question is how do I compute the time from the DWT_CYCCNT? I am guessing this is running at CPU speed but is it incrementing every clock tick or every machine cycle? If machine cycle, then how to translate to time? My target is a Kinetis K64F Cortex-M4.
As always thank you!
LikeLike
Hi Mike,
yes, the DWT_CYCCNT runs at the core/system clock speed (SystemCoreClock in CMSIS-Core terms). It is good as a time stamp to measure code execution time in an accurate way. But that time will affected by the overhead to read the DWT_CYCCNT register and what the compiler or pipelines/caches are doing, so might not be always the same depending on pipeline/cache. There is a good article about this here: http://www.carminenoviello.com/2015/09/04/precisely-measure-microseconds-stm32/. But +/- 50us should be really doable. Other than that, if you have a high speed timer available, you can but you need to run that timer say with a 5us clocking (without interrupts, of course!), then read that timer counter register for your measurement.
LikeLiked by 1 person
Pingback: What is “Realtime Debugging”? | MCU on Eclipse
Pingback: McuOnEclipse Components: 12-Mar-2017 Release | MCU on Eclipse
Thanks for the tutorial, this was very helpful.
LikeLike
Pingback: ARM SWO Performance Counters | MCU on Eclipse
hello,the register on DWT is too small ie the CPICNT only 8bits, how could i get the overflow event without effect the counting result? Thanks!
LikeLike
The cycle counter is 32bit, I’m not aware of an overflow event.
LikeLike
Pingback: Performance and Runtime Analysis with FreeRTOS | MCU on Eclipse
Hi Erich,
Thanks for your post – very helpful. However, I am attempting to measure the number of cycles for a piece of code which exceeds 2^32 CPU clock cycles in time, for an ARM Cortex M7 processor. Therefore there is an overflow issue and the counter gives me the wrong value. How would I go about changing the code above, to allow the counter to count above 2^32 CPU clock cycles?
I have tried changing the ‘cycles’ variable type to ‘uint64_t’ however it does not solve the issue.
Many thanks
LikeLike
Hi Marcus,
changing the variable to larger type does not help.
What you can do is:
a) find out how long it approximately takes the counter to overflow
b) Configure an interrupt at least twice as fast as this time (maybe 10x times)
c) In that interrupt, get the cycle counter minus the previous counter value to get the delta
d) add that delta to your uint64_t variable
This will add some overhead, but at least allows you to count it >32bits.
Another approach would be to configure a hardware watchpoint trigger to trigger when the counter is about to overflow.
I hope this helps,
Erich
LikeLike
Hi, I am currently facing the same issue as Marcus.
I am trying to configure the hardware watchpoint trigger for counting overflows of the DWT CYCCNT counter. From the ARM docs online, I suppose I should setup the DWT FUNCTION0 to CYCMATCH and DWT COMP0 to 0xFFFFFFFF, which should generate some internal DWT event when CYCCNT equals COMP0 (i.e., is about to overflow).
I am not sure how to proceed further, I guess the compare event can propagate to the software through built-in ITM or ETM, but I was not able to find any relevant examples or tutorials online about this particular configuration.
Thanks for any help!
Vojta V.
LikeLike
Have you tried to set a watchpoint using the MCUXpresso IDE, at least for testing?
LikeLike
Well I am using STM32CubeIDE with Nucleo-H745ZI-Q.
However I probably solved it. I initialize DWT as:
CoreDebug->DEMCR |= CoreDebug_DEMCR_TRCENA_Msk;
DWT->FUNCTION0 |= DWT_FUNCTION_CYCMATCH_Msk | 0x01;
DWT->COMP0 = 0xFFFFFFFF;
DWT->CYCCNT = 0;
DWT->CTRL |= DWT_CTRL_CYCCNTENA_Msk;
The bit 24 of DWT->FUNCTION0 (DWT_FUNCTION_MATCHED_Msk) is set when the overflow occurs, I tested it with the debugger.
I also wanted it to produce a interrupt, however when I tried to use DebugMon_Handler, each overflow also paused the debug session which I don’t want.
So I just increment the 64-bit cycle counter variable by 2^32 whenever the bit is set, while checking it in external counter peripheral IRQHandler (updating it by calling get_cyccnt_ext() function):
typedef union {
uint64_t u64;
uint32_t u32[2];
} cyccnt_ext_t;
volatile cyccnt_ext_t cyccnt_ext = {.u64 = 0};
uint64_t get_cyccnt_ext() {
if (DWT->FUNCTION0 & DWT_FUNCTION_MATCHED_Msk) cyccnt_ext.u32[1]++;
cyccnt_ext.u32[0] = DWT->CYCCNT;
return cyccnt_ext.u64;
}
I just wanted to use cycle count related information about execution time of tasks of FreeRTOS, so I check the overflows in vApplicationTickHook() and in getRunTimeCounterValue() I have just return get_cyccnt_ext() >> 8; (I divide it because the runtime debugger values are only 32-bit).
Thanks anyway.
LikeLike
Hi Vojta,
thanks, that’s very useful!
LikeLike
Pingback: Measuring ARM Cortex-M CPU Cycles Spent with the MCUXpresso Eclipse Registers View | MCU on Eclipse
Pingback: Tutorial: Using Runtime Statistics with Amazon FreeRTOS V10 | MCU on Eclipse
Hi Erich,
Thanks for the guide. Hovewer i got one question about cycle couting. Let’s say i got 48MHz system clock and my function took 2000 cycles so that means that micrcontroller needed around 41,6us to execute it?
Thanks 🙂
LikeLike
yes.
LikeLike
Pingback: Be aware: Floating Point Operations on ARM Cortex-M4F | MCU on Eclipse
It’s very helpful, bat how to do this with KL05 uC? It is possible to count microseconds in this tiny uC? Like micros() in arduino?
LikeLike
The KL05 is a reduced ARM Cortex with less featuers, so it does not have the cycle counting feature.
But you can use a normal timer at a high frequency for this. Just consider the extra overhead, so you have to calculate this in.
Another approach is to use SEGGER SystemView: https://mcuoneclipse.com/2015/11/16/segger-systemview-realtime-analysis-and-visualization-for-freertos/
which does use a timer too.
LikeLike
Thanks for this post. I needed to measure the time difference on triggers between two sensors attached to a Teensy 4.1 but with a time resolution better than 0.1us. This works perfectly.
LikeLike
Hi Steven,
yes, I’m using exactly for such kind of things. It is very handy too for a delay loop not requiring a timer.
LikeLike
Hi, Erich.
Thank you for this excellent post! I’m just start learnig how to work with restrict environments and I’m have been struggle with measuring CPU cycles. I have a main.c and several others functions in differents .c files. I measured the cycles on the main and inside some anothers functions (external files). However, the total result is pretty close of the several spreaded counters, sometimes lower. How could I measure the total cycles of my all program and its several functions calls? I’m testing in a KL25Z board. Thx in advance.
LikeLiked by 1 person
Hi Felipe,
unfortunately on the KL25Z, as this is a Cortex-M0+, ,you do not have the DWT or cycle counter. You have several options:
a) using an internal timer counter. Keep in mind that you should not use interrupts or timer interrupts, just use the timer counter. For shorter measurement you need to keep in mind the overhead to start/read the timer registers.
b) toggling a GPIO pin and measure it with an external scope: here keep in mind the overhead of writing the GPIO register.
As a general comment: keep in mind the time spent on interrupts (if any).
I hope this helps,
Erich
LikeLike
Thank you, Erich, for this post. It is very helpful and the example code saved me a ton of time. I’ll definitely save my notes on this one.
LikeLike
Thank you!
LikeLike