
FreeRTOS includes a nice feature to give me information about how much time every task is spending running on the system:

FreeRTOS Runtime Information
This tutorial explains that FreeRTOS Runtime Statistics feature and how it can be turned on and used.
Software and Tools
In this article, I’m using the following:
But of course any other tools/IDEs or FreeRTOS version could be used (FreeRTOS should be at least version 9.0.0 or later).
Using the steps below, it is as well possible to update an existing project with FreeRTOS task runtime information gathering.
How it works
FreeRTOS uses a user/application specific timer to measure the task execution time. For this, every task descriptor inside the RTOS has a cumulative counter which adds the timer ticks spent for that task. The current timer tick count are memorized when a task gets the CPU time and again when the RTOS switches out that task. That delta time which corresponds the task execution time is then added to the task execution time counter.
I need to configure FreeRTOS with the following macro set to 1 to perform runtime analysis:
#define configGENERATE_RUN_TIME_STATS 1
Additionally the following two macros need to be provided:
portCONFIGURE_TIMER_FOR_RUN_TIME_STATS()
portGET_RUN_TIME_COUNTER_VALUE()
Which are used by the RTOS to configure the runtime counter timer and to get the timer value.
The runtime counter is stored as 32bit value inside each task descriptor which means my RAM requirements for the system will go up 4 bytes for each task:

ulRunTimeCounter in FreeRTOS TCB
💡 Assuming a 10 kHz (0.1 ms) counter period, this means that the variable will overflow after about 5 days.
Additionally, the RTOS maintains to extra global variables in task.c:
#if ( configGENERATE_RUN_TIME_STATS == 1 )
	PRIVILEGED_DATA static uint32_t ulTaskSwitchedInTime = 0UL;	/*< Holds the value of a timer/counter the last time a task was switched in. */
	PRIVILEGED_DATA static uint32_t ulTotalRunTime = 0UL;		/*< Holds the total amount of execution time as defined by the run time counter clock. */
#endif
The first variable is used to remember the time when a task is switched in, and the second one is the total runtime of the system. This is what happens at task switch time (Kernel function vTaskSwitchContext):
/* Add the amount of time the task has been running to the
accumulated time so far.  The time the task started running was
stored in ulTaskSwitchedInTime.  Note that there is no overflow
protection here so count values are only valid until the timer
overflows.  The guard against negative values is to protect
against suspect run time stat counter implementations - which
are provided by the application, not the kernel. */
if( ulTotalRunTime > ulTaskSwitchedInTime )
{
	pxCurrentTCB->ulRunTimeCounter += ( ulTotalRunTime - ulTaskSwitchedInTime );
}
else
{
	mtCOVERAGE_TEST_MARKER();
}
ulTaskSwitchedInTime = ulTotalRunTime;
Typically a periodic timer interrupt is used to count the execution time, and that timer frequency should be about 10x the time of the tick interrupt frequency (say ‘hello’ to “Nyquist-Shannon” sampling theorem 🙂 ). Which means if my tick interrupt is 1 kHz, my runtime analysis timer frequency should be 10 kHz.
The runtime statistics usually are presented with two numbers:
- An absolute (time) number
- A percentage
Below is a textual task list with the runtime information to the right:
TCB Static Handle     Name         State    Prio    Stack Beg  Stack End  Size    Stack Top            Unused  Runtime
1   no (0) 0x20000450 Shell        Running  (1,1)   0x20000440 0x20000060  1000 B 0x200001EC (  600 B)   392 B 0x00000000 ( <1%)
7   no (0) 0x20001E68 IDLE         Ready    (0,0)   0x20001E58 0x20001CD0   400 B 0x20001DFC (   96 B)   312 B 0x00007C35 ( 91%)
2   no (0) 0x20000740 Refl         Blocked  (4,4)   0x20000730 0x20000510   552 B 0x200006BC (  120 B)   384 B 0x00000C6E (  9%)
6   no (0) 0x20001C68 Main         Blocked  (1,1)   0x20001C58 0x20001A08   600 B 0x20001BDC (  128 B)   356 B 0x00000000 ( <1%)
3   no (0) 0x20001378 Radio        Blocked  (3,3)   0x20001368 0x20000F88  1000 B 0x200012F4 (  120 B)   680 B 0x00000001 ( <1%)
4   no (0) 0x20001658 Sumo         Blocked  (2,2)   0x20001648 0x20001458   504 B 0x200015C4 (  136 B)   360 B 0x00000000 ( <1%)
5   no (0) 0x20001948 Drive        Blocked  (3,3)   0x20001938 0x20001748   504 B 0x200018B4 (  136 B)   264 B 0x00000000 ( <1%)
The absolute number is the number of runtime timer ticks (ulRunTimeCounter in the TCB) and the percentage of this counter in relation to the total runtime (ulTotalRunTime in task.c).
For the IDLE task it shows this
TCB Static Handle Name State Prio Stack Beg Stack End Size Stack Top Unused Runtime
7 no (0) 0x20001E68 IDLE Ready (0,0) 0x20001E58 0x20001CD0 400 B 0x20001DFC ( 96 B) 312 B 0x00007C35 ( 91%)
0x7C35 is the timer counter (using a 0.1 ms timer in this example, so it means that the IDLE task run for about 3 seconds (0x7C35/10 => 3179 ms) and used 91% of the runtime.
The question might be: what about the time spent in interrupts? The answer is that the RTOS does not know about the interrupts, it only knows about how much runtime timer ticks a task has used. Or in other words: the runtime shows by the FreeRTOS runtime counter *includes* the time of interrupts.
Tutorial: Runtime Analysis with FreeRTOS
In the next sections I show how to enable runtime analysis with FreeRTOS. The basic steps are
- Create a new project (if not already exists)
- Update FreeRTOSConfig.h
- Initialize and configurre timer
- Add hooks/callbacks to application
Create Project
Create a project for your board:
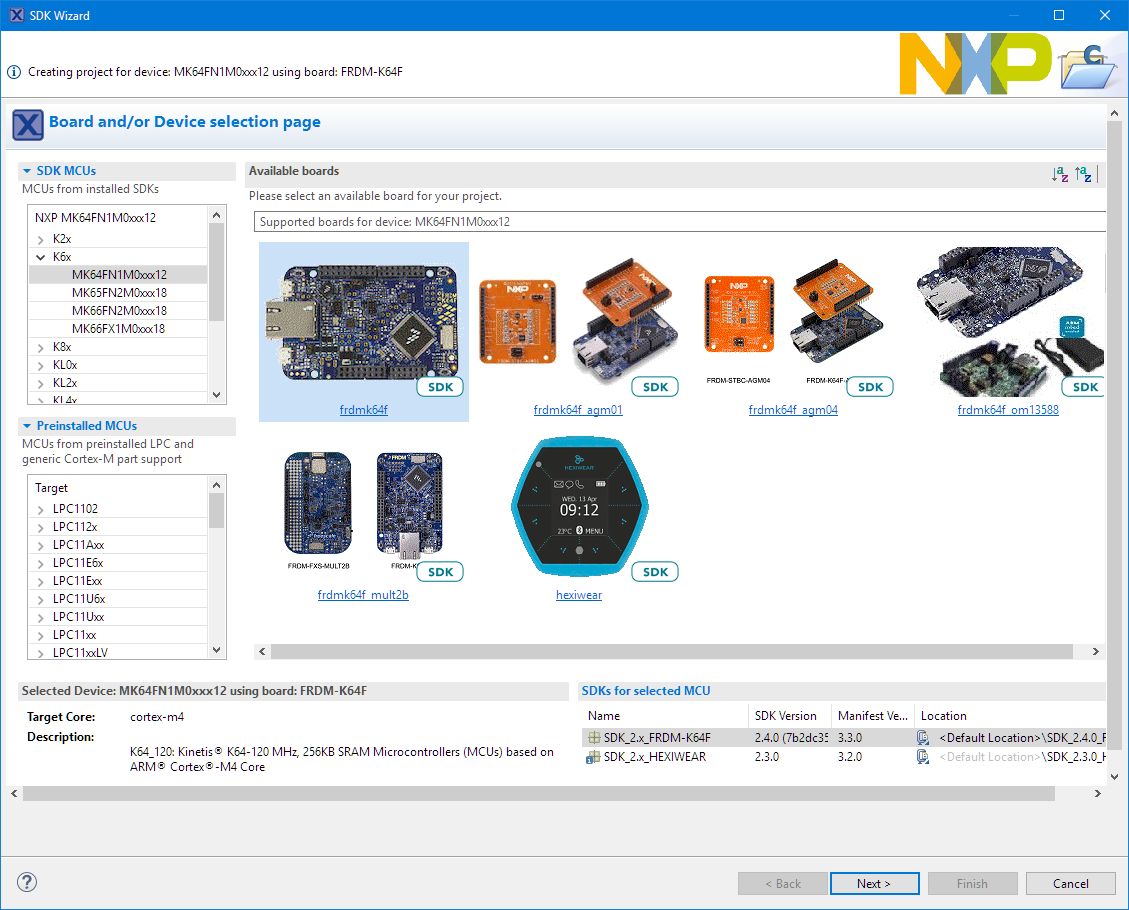
Bord for Project Creation
Make sure FreeRTOS is included:

FreeRTOS option for project
Add FreeRTOS Task
Next add a task, for example something like this:
#include "FreeRTOS.h"
#include "task.h"

static void MyTask(void *pvParameters) {
  for(;;) {
    vTaskDelay(pdMS_TO_TICKS(100));
  }
}
Inside main(), create a task and start the scheduler:
   /* create task */
    if (xTaskCreate(MyTask, "MyTask", 500/sizeof(StackType_t), NULL, tskIDLE_PRIORITY+1, NULL) != pdPASS) {
      for(;;){} /* error */
    }
    vTaskStartScheduler(); /* start RTOS */
    for(;;) {
    	/* should not get here */
    }
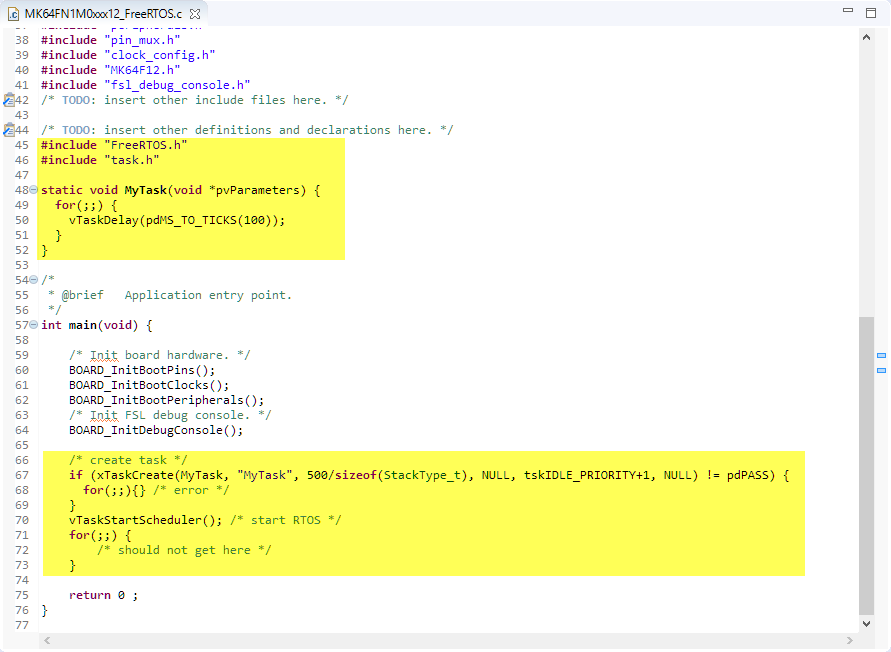
Added FreeRTOS Task
Build and debug that project, just to make sure everything is working fine.
Debugging FreeRTOS Task
💡 To show the FreeRTOS threads in the Debug view, see https://mcuoneclipse.com/2018/06/29/show-freertos-threads-in-eclipse-debug-view-with-segger-j-link-and-nxp-s32-design-studio/
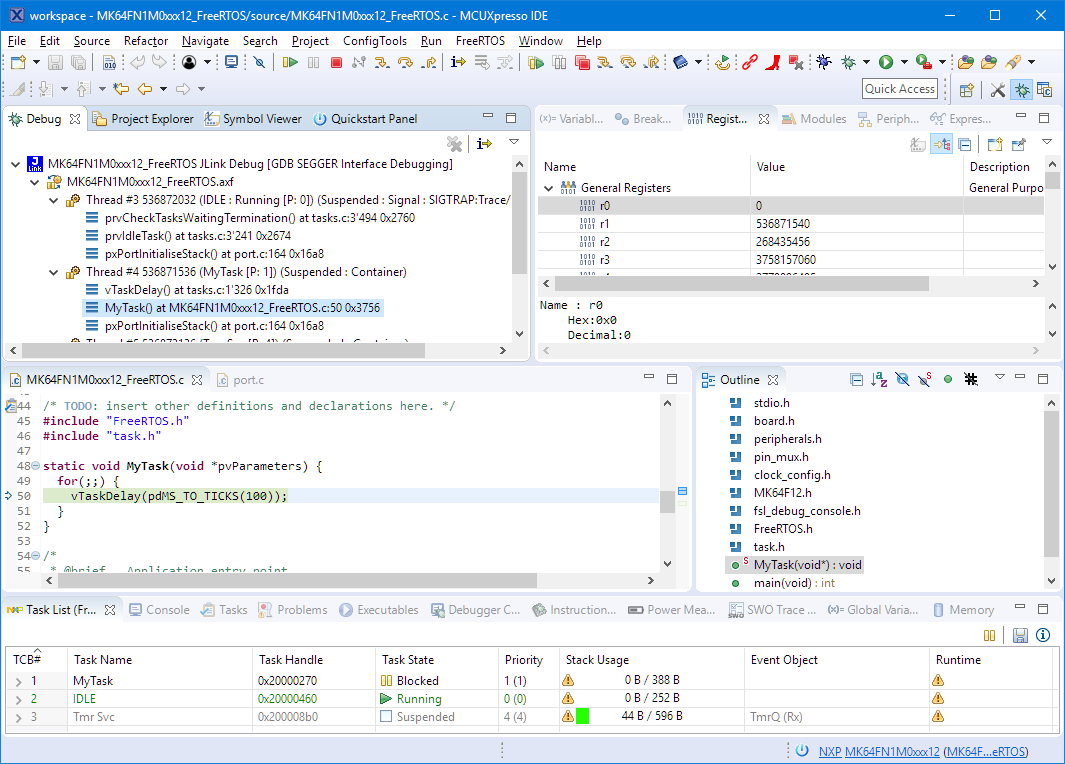
But the FreeRTOS task list (use the Menu FreeRTOS > Task List to show that view) does not show any runtime information:
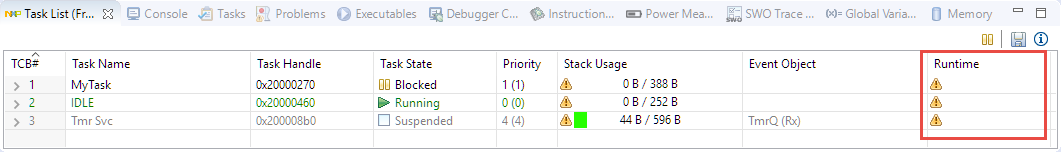
FreeRTOS Task List with no Runtime Information
This is what we are going to add in the next steps.
Trace and Runtime Statistics
Inside FreeRTOSConfig.h, make sure the following defines are set to 1 (turned on):
#define configGENERATE_RUN_TIME_STATS 1 /* 1: generate runtime statistics; 0: no runtime statistics */
#define configUSE_TRACE_FACILITY      1 /* 1: include additional structure members and functions to assist with execution visualization and tracing, 0: no runtime stats/trace */
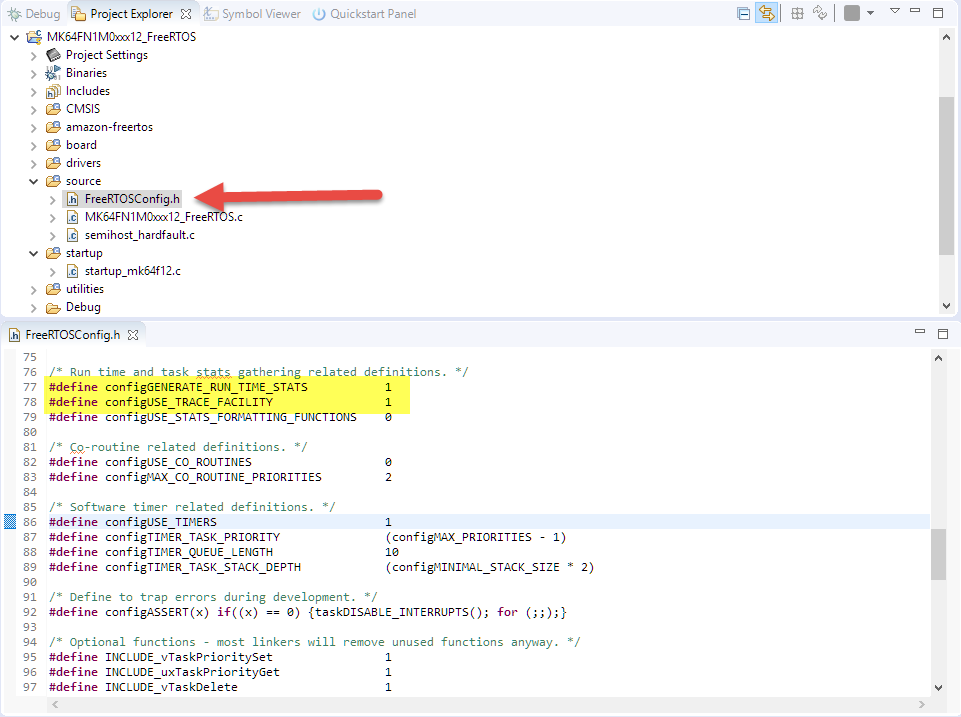
Enabled runtime stats and trace functionality
The configUSE_TRACE_FACILITY is needed for the RTOS to have the additional data elements in the task descriptor present to store the runtime counter, the configGENERATE_RUN_TIME_STATS itself turns the functionality on to record task execution time.
Configuring the Timer
Next we have to setup a timer to measure the task execution time. That timer should run at least 10x faster than the RTOS Tick timer.
In our example the tick rate is 1 kHz:
#define configTICK_RATE_HZ ((TickType_t)1000)
Which means our runtime timer shall run at least with 10 kHz.
To configure such a timer, I can use the MCUXpresso Configuration Peripheral tool:
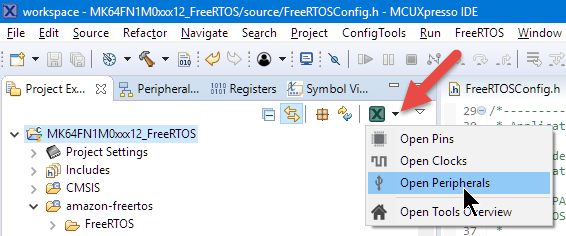
Peripherals Tool
In the Peripheral Tool, we are picking the FTM0 timer (we could use any other timer too).
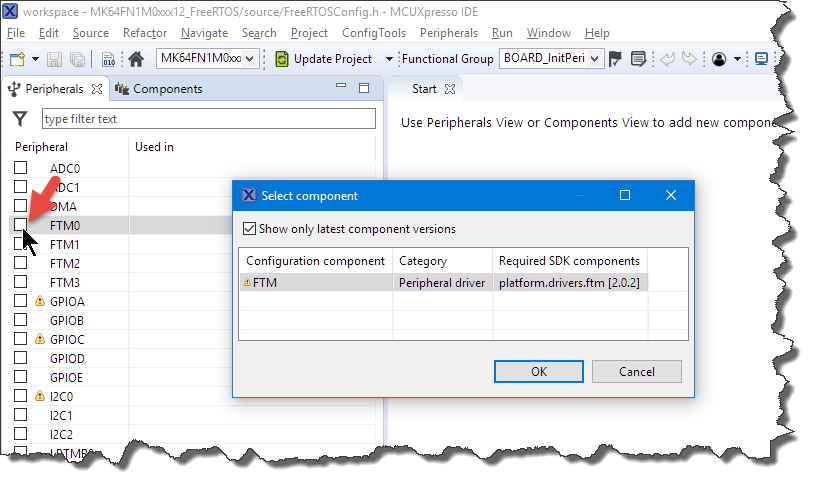
Adding FTM0
The timer gets configured for 10 kHz:
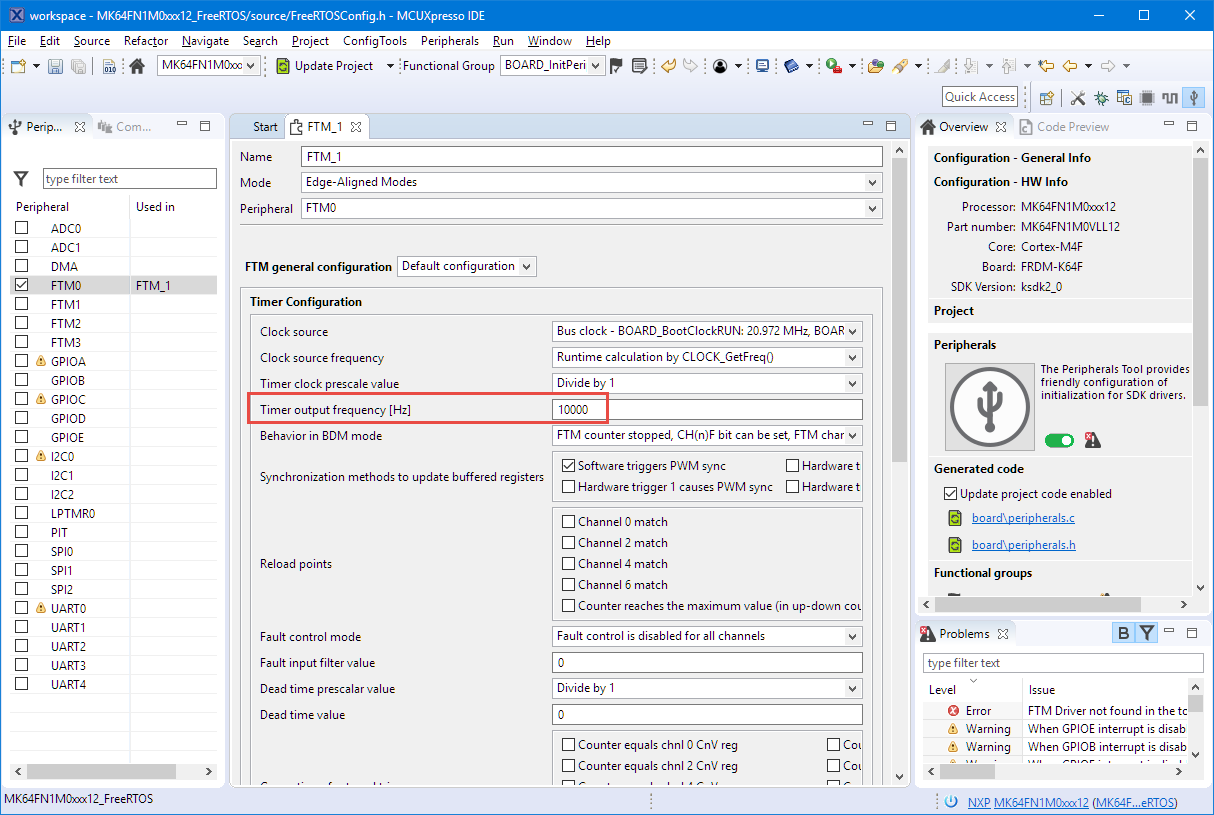
Timer output frequency
We will use the timer interrupt to increase a counter, so don’t forget to turn the interrupt on:
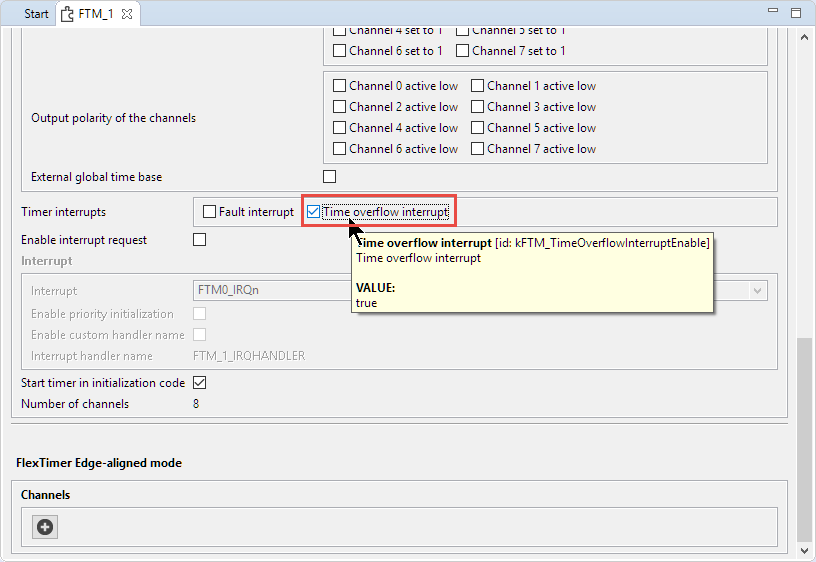
Timer Overflow Interrupt Enabled
Then click the button to update the project sources:
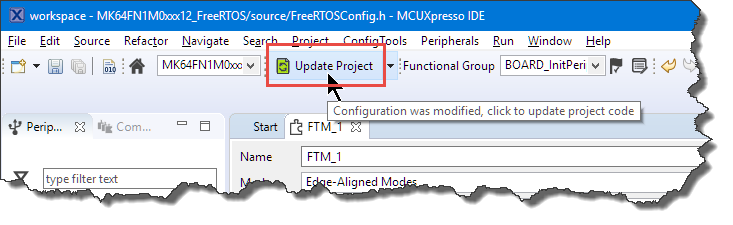
Updated Project
Switch back to the developer perspective.
Timer ISR
Next we add the timer interrupt code to the application:
#include "fsl_ftm.h"
static uint32_t RTOS_RunTimeCounter; /* runtime counter, used for configGENERATE_RUNTIME_STATS */

void FTM0_IRQHandler(void) {
  /* Clear interrupt flag.*/
  FTM_ClearStatusFlags(FTM0, kFTM_TimeOverflowFlag);
  RTOS_RunTimeCounter++; /* increment runtime counter */
}
Adding Timer Drivers
The project won’t compile yet, because the necessary drivers are not part of the project yet. To add them, use the ‘Manage SDK Components’ button:
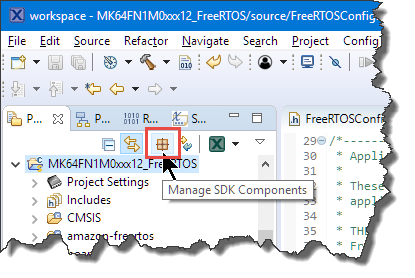
Manage SDK Components Button
Then check the ftm driver and press OK and get the extra driver sources added to the project.
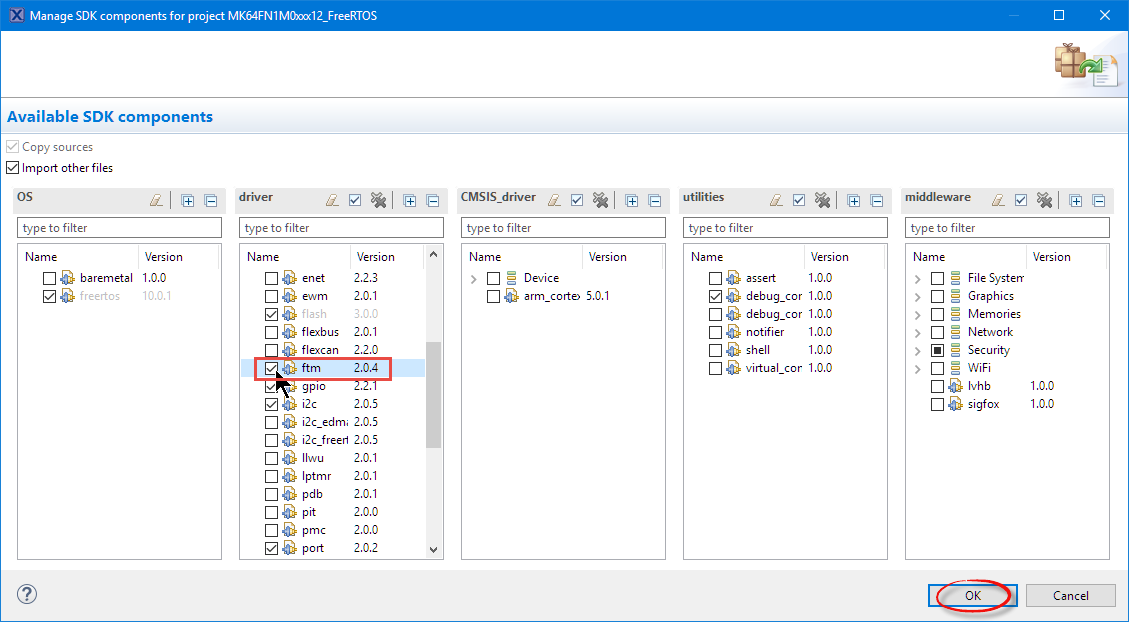
FTM Driver
Adding Timer to FreeRTOS: FreeRTOS Timer Macros for Runtime Statistics
Add the following lines to the FreeRTOSConfig.h:
extern void RTOS_AppConfigureTimerForRuntimeStats(void);
#define portCONFIGURE_TIMER_FOR_RUN_TIME_STATS()   RTOS_AppConfigureTimerForRuntimeStats()
extern uint32_t RTOS_AppGetRuntimeCounterValueFromISR(void);
#define portGET_RUN_TIME_COUNTER_VALUE()           RTOS_AppGetRuntimeCounterValueFromISR()
This tells FreeRTOS which function it shall use to initialize the timer and what function for getting the timer value.
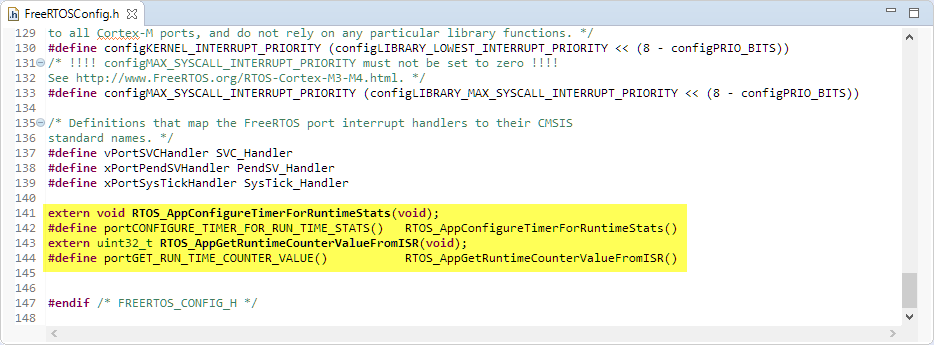
Added Runtime Counter Settings to FreeRTOSConfig.h
FreeRTOS Callback for Timer
Now we need to add the two callbacks we have configured FreeRTOS to use.
void RTOS_AppConfigureTimerForRuntimeStats(void) {
  RTOS_RunTimeCounter = 0;
  EnableIRQ(FTM0_IRQn);
}

uint32_t RTOS_AppGetRuntimeCounterValueFromISR(void) {
  return RTOS_RunTimeCounter;
}
Running….
Build and debug your application. If you stop now the application and inspect the Task List, it shows now the Runtime information:
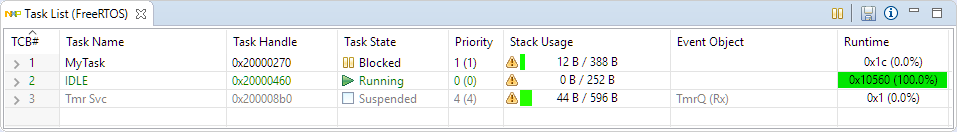
Runtime information displayed
🙂
No Eclipse? No Problem!
Above I was using the Eclipse Task List view for FreeRTOS which is something NXP did for their Eclipse based IDE’s (MCUXpresso IDE, S32DS for ARM and Kinetis Design Studio). But it is possible to show that information directly from the application, e.g. on a terminal LCD display. The FreeRTOS on McuOnEclipse includes a shell/terminal interface which uses this.

Task Runtime Information on Console
The code snippet below shows how that information is printed for each task:
#if configGENERATE_RUN_TIME_STATS
  ulTotalTime = portGET_RUN_TIME_COUNTER_VALUE(); /* get total time passed in system */
  ulTotalTime /= 100UL; /* For percentage calculations. */
#endif
...
#if configGENERATE_RUN_TIME_STATS && configUSE_TRACE_FACILITY
      /* runtime */
      UTIL1_strcpy(tmpBuf, sizeof(tmpBuf), (unsigned char*)"0x");
      UTIL1_strcatNum32Hex(tmpBuf, sizeof(tmpBuf), taskStatus.ulRunTimeCounter);
      if (ulTotalTime>0) { /* to avoid division by zero */
        /* What percentage of the total run time has the task used?
           This will always be rounded down to the nearest integer.
           ulTotalRunTime has already been divided by 100. */
        ulStatsAsPercentage = taskStatus.ulRunTimeCounter/ulTotalTime;
        if (ulStatsAsPercentage>0) {
          UTIL1_strcat(tmpBuf, sizeof(tmpBuf), (unsigned char*)" (");
          UTIL1_strcatNum16uFormatted(tmpBuf, sizeof(tmpBuf), ulStatsAsPercentage, ' ', 3);
          UTIL1_strcat(tmpBuf, sizeof(tmpBuf), (unsigned char*)"%)");
        } else {
          /* If the percentage is zero here then the task has consumed less than 1% of the total run time. */
          UTIL1_strcat(tmpBuf, sizeof(tmpBuf), (unsigned char*)" ( <1%)");
        }
      }
      buf[0] = '\0';
      UTIL1_strcatPad(buf, sizeof(buf), tmpBuf, ' ', PAD_STAT_TASK_RUNTIME);
      CLS1_SendStr(buf, io->stdOut);
#endif
      CLS1_SendStr((unsigned char*)"\r\n", io->stdOut);
Summary
FreeRTOS Runtime Statistics is a very useful feature: it shows me how much time is used by each task including its interrupt time. All what I need is to set some FreeRTOS configuration macros and to set up a periodic timer interrupt. Of course this does not come for free with an extra timer interrupt and the RAM and FLASH needed for that functionality, but it can be easily turned off for the final release if desired.
Happy Runtiming 🙂
Links
- Example project on GitHub: https://github.com/ErichStyger/mcuoneclipse/tree/master/Examples/MCUXpresso/FRDM-K64F/FRDM-K64F_SDK_FreeRTOS
- Performance and Runtime Analysis with FreeRTOS
- MCUXpresso IDE web page: http://www.nxp.com/mcuxpresso/ide
- MCUXpresso IDE community: http://www.nxp.com/mcuxpresso/ide/forum
- Better FreeRTOS Debugging in Eclipse
- McuOnEclipse Library project: https://github.com/ErichStyger/McuOnEclipseLibrary/tree/master/lib/FreeRTOS/Source
- ARM Cortex-M Cycle Counter: https://mcuoneclipse.com/2017/01/30/cycle-counting-on-arm-cortex-m-with-dwt/
- Better FreeRTOS Debugging: https://mcuoneclipse.com/2017/03/18/better-freertos-debugging-in-eclipse/
- FreeRTOS RuntimeStats: https://www.freertos.org/rtos-run-time-stats.html

Excellent post Erich, thanks! Came at the right time. I was just looking for something like this.
LikeLike
Pingback: FreeRTOS Task Runtime Statistics for NXP i.MX RT1064 | MCU on Eclipse
Hi Erich,
Thank you for putting this together – it’s very helpful and useful!
LikeLike