
As a standard procedure, I add some console functionality to my embedded applications. That way I have a command line interface and can inspect and influence the target system. One interesting hardware feature of ARM Cortex-M is Single Wire Output (SWO): it allows to send out data (e.g. strings) over up to 32 different stimulus ports, over a single wire.

swo-pin-on-arm-debug-header
Debug Trace Output? SWO!
As the standard text and command line interface to my target boards I’m using a normal UART/SCI. However, on many boards the UART’s are used by the application.
There is semihosting, but this is very slow, depends on the debugger and toolchain/library used plus is a wast of FLASH and RAM so I don’t recommend using semihosting at all.
There is USB CDC, but this requires a USB connector, a USB stack and a microcontroller capable of USB. Not applicable in all cases.
There is Segger RTT which is small, fast and best of all does not need any special pins. But works only with Segger debugging probes.
ARM SWO
But there is yet another thing: ARM SWO trace port as defined by ARM for Cortex-M. Technically SWO is a single trace pin which is used to stream out data packets with a certain clock rate, derived from the CPU core clock. You can think of SWO as a kind of UART TX pin using a special format to send out data packets. Up to 32 packet types (or stimulus) can be used. What kind of data is sent is up to the application, and there is only very little CPU processing or code needed.
Common SWO usages are:
- Sending debug messages as strings
- Recording interrupt entry/exit
- Recording function entry/exit
- Periodic PC value sampling
- Event notification
- Variable or memory cell change over time
One of the most common usage is the first one: using SWO to print debug messages from the target in UART style. And this is what I’m going to show in this article. There would be another encoding (Manchester encoded) which is not covered here.
ARM CoreSight
SWO is part of the ARM CoreSight Debug block which usually is part of Cortex-M3, M4 and M7:

coresight-debug (Source: http://www.arm.com/files/pdf/AT_-_Advanced_Debug_of_Cortex-M_Systems.pdf)
As shown in that overview slide, over SWO (or SWV) ITM and DWT trace messages can be sent. For instruction trace up to 4 extra trace pins are required (see “First Steps with Ozone and the Segger J-Link Trace Pro” how to get instruction trace).
SWO Pin
The precondition to use SWO is that the this pin is available on the debug header. This is the case for my TWR-K64F120M board:

trace_swo_pin (Source: TWR-K64F120M Schematics)
As shown above, the SWO trace pin is shared with the JTAG TDO pin. So this means that SWO cannot be used with JTAG, it only can be used with SWD (see “SWD Debugging with the FRDM-KL25Z Board“).
Carefully check your board schematics if it supports SWO. For example on the FRDM-K64F (same device as on above TWR-K64F120M), the SWO pin is *not* routed to the debug header:

no-swo-on-frdm-k64f
Debug Probe and SWO
In order to use SWO, I need a debug probe capable reading the SWO pin. For example the Freescale/NXP OpenSDA onboard debug interface hardware on the Freedom and Tower modules does not support SWO (see “Solving “The connected emulator does not support serial wire output (SWO)”“).
The external Segger J-Link however do support the SWO pin. Below I have a J-Link EDU connected to the debug and trace port of the TWR-K64F120M board:

j-link-edu-connected-to-trace-port
Source Code to Send Debug Messages over SWO Trace Pin
In order to write debug message over SWO to the host, a small piece of code is needed.
💡 An example project with all the sources is available on GitHub: https://github.com/ErichStyger/mcuoneclipse/tree/master/Examples/KDS/TWR-K64F120M/TWR-K64F120M_Demo/Sources
External tools (like the Segger RTT viewer) can set up the SWO in the hardware. My recommendation is to initialize it from the application. Because the SWO trace output clock is derived from the CPU clock, the Init function needs that clock plus which SWO port number to be initialized. Below is the code I’m using to initialize the SWO output to a default of 64k baud:
/*!
 * \brief Initialize the SWO trace port for debug message printing
 * \param portBits Port bit mask to be configured
 * \param cpuCoreFreqHz CPU core clock frequency in Hz
 */
void SWO_Init(uint32_t portBits, uint32_t cpuCoreFreqHz) {
  uint32_t SWOSpeed = 64000; /* default 64k baud rate */
  uint32_t SWOPrescaler = (cpuCoreFreqHz / SWOSpeed) - 1; /* SWOSpeed in Hz, note that cpuCoreFreqHz is expected to be match the CPU core clock */

  CoreDebug->DEMCR = CoreDebug_DEMCR_TRCENA_Msk; /* enable trace in core debug */
  *((volatile unsigned *)(ITM_BASE + 0x400F0)) = 0x00000002; /* "Selected PIN Protocol Register": Select which protocol to use for trace output (2: SWO NRZ, 1: SWO Manchester encoding) */
  *((volatile unsigned *)(ITM_BASE + 0x40010)) = SWOPrescaler; /* "Async Clock Prescaler Register". Scale the baud rate of the asynchronous output */
  *((volatile unsigned *)(ITM_BASE + 0x00FB0)) = 0xC5ACCE55; /* ITM Lock Access Register, C5ACCE55 enables more write access to Control Register 0xE00 :: 0xFFC */
  ITM->TCR = ITM_TCR_TraceBusID_Msk | ITM_TCR_SWOENA_Msk | ITM_TCR_SYNCENA_Msk | ITM_TCR_ITMENA_Msk; /* ITM Trace Control Register */
  ITM->TPR = ITM_TPR_PRIVMASK_Msk; /* ITM Trace Privilege Register */
  ITM->TER = portBits; /* ITM Trace Enable Register. Enabled tracing on stimulus ports. One bit per stimulus port. */
  *((volatile unsigned *)(ITM_BASE + 0x01000)) = 0x400003FE; /* DWT_CTRL */
  *((volatile unsigned *)(ITM_BASE + 0x40304)) = 0x00000100; /* Formatter and Flush Control Register */
}
From my main application I initialize it like this (for a system with a 24 MHz core clock):
#define CPU_CORE_FREQUENCY_HZ 120000000 /* CPU core frequency in Hz */

SWO_Init(0x1, CPU_CORE_FREQUENCY_HZ);
The printing is done in SWO_PrintChar():
/*!
 * \brief Sends a character over the SWO channel
 * \param c Character to be sent
 * \param portNo SWO channel number, value in the range of 0 to 31
 */
void SWO_PrintChar(char c, uint8_t portNo) {
  volatile int timeout;

  /* Check if Trace Control Register (ITM->TCR at 0xE0000E80) is set */
  if ((ITM->TCR&ITM_TCR_ITMENA_Msk) == 0) { /* check Trace Control Register if ITM trace is enabled*/
    return; /* not enabled? */
  }
  /* Check if the requested channel stimulus port (ITM->TER at 0xE0000E00) is enabled */
  if ((ITM->TER & (1ul<<portNo))==0) { /* check Trace Enable Register if requested port is enabled */
    return; /* requested port not enabled? */
  }
  timeout = 5000; /* arbitrary timeout value */
  while (ITM->PORT[0].u32 == 0) {
    /* Wait until STIMx is ready, then send data */
    timeout--;
    if (timeout==0) {
      return; /* not able to send */
    }
  }
  ITM->PORT[0].u16 = 0x08 | (c<<8);
}
The above code uses a very simple timeout mechanism: the important point is not to block if SWO is not enabled or if SWO port is not ready, otherwise the application will blocked.
To make it easier to print a string, I’m using the following function:
/*!
 * \brief Sends a string over SWO to the host
 * \param s String to send
 * \param portNumber Port number, 0-31, use 0 for normal debug strings
 */
void SWO_PrintString(const char *s, uint8_t portNumber) {
  while (*s!='\0') {
    SWO_PrintChar(*s++, portNumber);
  }
}
To send a ‘hello’ over SWO it gets as easy as this:
SWO_PrintString("hello world with SWO\r\n", 0);
The first parameter is the string to send, the second is the SWO trace channel number.
GNU Arm Eclipse Viewer
To receive the SWO trace output on the host, the GNU ARM Eclipse plugins have built-in SWO support for the Segger J-Link probes.
SWO only is supported in SWD (Single Wire Debug) mode, and not in JTAG mode. So make sure that SWD is selected as debugging protocol:

swd-debug
In the GNU ARM Eclipse debug configuration, enable SWO and specify the CPU frequency and the SWO frequency (see the documentation about the frequencies on http://gnuarmeclipse.github.io/debug/jlink/). I have to provide the CPU frequency (120 MHz in my case), and can leave the SWO freqenzy at 0 so the J-Link will automatically determine the speed). Specify in the port mask the ports (as bitmask) used, so 0x1 is for using port 0:
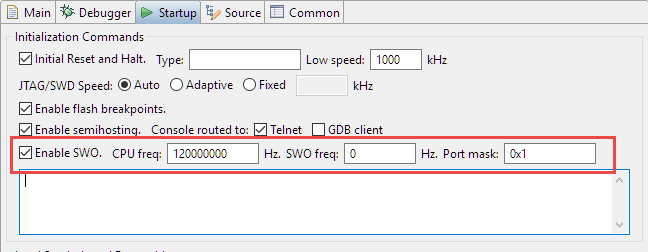
swo-settings
With this, running the application on the target it shall show the output in the Eclipse Console View:
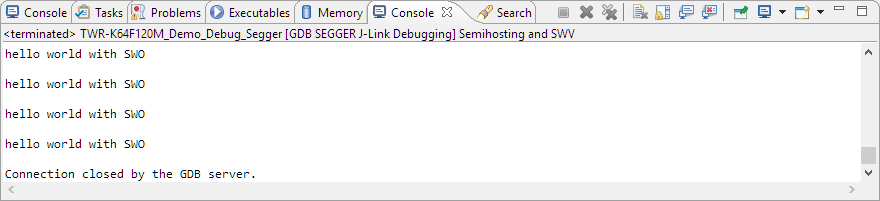
eclipse-console-view
Segger SWO Viewer
Segger has a special SWO Viewer (both command line and GUI version).
In the GUI version I specify the device used, and it can sense the trace clock:

segger-gui-swo-viewer
In the viewer I can turn on/off ports and se the data received:

segger-j-link-swo-viewer
Telnet: Putty
But there is no fancy viewer or Eclipse needed to see the SWO data. Segger is using by default the port 2332:

segger-swo-port
I can configure any telnet client (e.g. PuTTY) to open a session on port 2332:
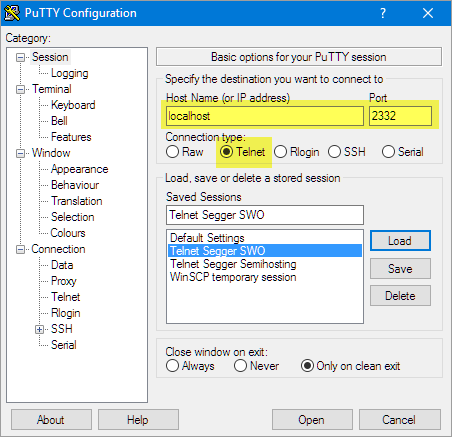
putty-telnet-session-settings
And the I get the output in PuTTY:

swo-output-in-putty
Summary
The ARM SWO trace pin allows to send trace messages to the host. One common usage is to send debug or other messages to the host. SWO only needs a single pin, works only with SWD (not JTAG) and requires little code and ressources on the target. Unfortunately many boards do not have the SWO trace pin routed to the debug header, so if you are making your own design, routing SWO to the debug header should be at least considered.
While SWO trace output is great, it is limited to the higher end Cortex-M, I did not find it in the Cortex-M0(+) available, and it is output only, and requires a debug probe/interface supporting it. At least with Eclipse and GNU ARM Eclipse plugins in combination with Segger J-Link probes SWO output has worked great for me.
On the other side, the Segger RTT is much more versatile and very fast too. It works on all ARM Cortex, and best of all, it does not need an extra pin :-). However, it requires little more overhead and RAM resources on the target system. Plus it allows both to send and receive data. So for the serial debug message printing, the Segger RTT sounds a better solution to me.
Happy SWO’ing 🙂
Links
- SWO on Kinetis: https://community.nxp.com/thread/318058
- SWO with GNU ARM Eclipse plugins: http://gnuarmeclipse.github.io/debug/jlink/
- Segger SWO Viewer: https://www.segger.com/j-link-swo-viewer.html
- GNU ARM Eclipse plugins: http://gnuarmeclipse.github.io/debug/
- Eclipse RxTx Plugin for parsing SWO data: http://forum.segger.com/index.php?page=Thread&threadID=1010
- ARM CoreSight Overview: http://www.arm.com/files/pdf/AT_-_Advanced_Debug_of_Cortex-M_Systems.pdf
- Example code on GitHub: https://github.com/ErichStyger/mcuoneclipse/tree/master/Examples/KDS/TWR-K64F120M/TWR-K64F120M_Demo/Sources

The projects generated by the GNU ARM Eclipse templates, and subsequently the projects using the µOS++/CMSIS++ APIs, all benefit from a trace channel, which can be routed either to semihosting, SWO or Segger RTT. The high level API is simple and very convenient: trace_putchar(), trace_puts() and trace_printf() (and their C++ versions, see http://micro-os-plus.github.io/reference/cmsis-plus/group__cmsis-plus-diag.html).
Highly recommended!
LikeLike
So many choices for debugging. I attended the LPCxpresso training at NXPFTF which used the LPC43xx boards I will need to check whether the trace used SWO Periodic PC value sampling or accessed the ETB – Embedded trace buffers. Whats the lowest cost method for instruction tracing ? Is it possible to obtain SWO sampling or ETB trace information for Kinetis devices using Ozone?
LikeLike
Hi Chad,
choices are good, right? Yes, LPCXpresso provides PC sampling over SWO. I have not found out how to explictily see this in Ozone, but it seems to me that the profiling they provide is based on exactly that. I have a K64F setup for the trace already, but I don’t see the profiling information yet.
I have see that PC sampling in the Segger Embedded Studio, see https://blog.segger.com/profilingsoftwareinembeddedsystems/
I plan to work on the SWO/ETB tracing with Ozone for Kinetis over the week-end if time permits.
LikeLiked by 1 person
I’m extremely interested if you succeed to get trace on swo/etb with ozone.
by the way i was sure that cortex M7 provides ETB buffer but i can’t find any information
LikeLike
Hi Brice,
I’m getting ETM trace on the trace pins (did not use SWO for this) with Kinetis K64F (M4F), see https://mcuoneclipse.com/2016/11/05/tutorial-getting-etm-instruction-trace-with-nxp-kinetis-arm-cortex-m4f/.
I have not tried this with M7 yet.
LikeLike
Pingback: Getting printf Output from Target to Debugger | SEGGER Blog
Pingback: Tutorial: Getting ETM Instruction Trace with NXP Kinetis ARM Cortex-M4F | MCU on Eclipse
Hi Erich
Nice article!
I just got it to work with my stm32 application, but some adjustments were needed:
Changed ITM->PORT[0].u16 = 0x08 | (c<PORT[portNo].u8 = (uint8_t)c;
(because I was getting some garbage along with the messages)
And I also changed 2 references of PORT[0] to PORT[portNo] in the SWO_PrintChar function, to correct the port selection
Now it works like a charm 🙂
I am getting the print thru the SWO viewer in the ST-LINK utility, I can even connect the STLINK in the application and start getting the messages “on the fly”, without resetting it! pretty handy
LikeLike
FOr some reason the text was wrong:
Changed :
ITM->PORT[0].u16 = 0x08 | (c<PORT[portNo].u8 = (uint8_t)c;
🙂
LikeLike
The problem is that wordpress thinks it is HTML code (unless you use the ‘code’ formatter in the comment?
LikeLike
Hi Gustavo,
thanks for the hint about the the port number: indeed, I have to fix this on my side too.
Not sure why you need to change the write to the ITM port: I saw something like this, but on my side just writing the character worked fine?
I saw as well http://forum.segger.com/index.php?page=Thread&threadID=1010 which used my approach.
LikeLike
Maybe is something related only to the STLINK SWO utility, and works just fine in GDB
I changed it based on ITM_SendChar function, from core_cm3.h
LikeLike
Hi Gustavo,
it seems to me that this is somehow a difference between M3 and M4 (should not be?), because in the core_cm4.h it is using
ITM->PORT[0U].u8 = (uint8_t)ch;
Anyway, thanks for the hint, good to know if I want to run this on a Cortex-M3.
LikeLike
Freescale/NXP seems to have routed SWO to the header on the FRDM-k64F at some point. The current schematic shows it routed and I’ve been able to get SWO working with my J-Link.
Bottom of the board says “SCH-28163 REV E3”.
LikeLike
Really interesting, thanks for sharing!
LikeLike
Can you elaborate why the 3rd bit is set and why the data byte is shifted 8 bits?
ITM->PORT[0].u16 = 0x08 | (c<<8);
LikeLike
Hi Jeff,
the swap is about little/big endian. I have to check about the 0x08 thing (I copied that from an example), but I think it is for marking a 16bit ITM transfer. I have to check that example. I see that other code simply writes to .u8, so this should be enough too.
LikeLike
Hi Erich.
This is really a nice article, thanks a lot.
I was wondering, do you know about any SWO alternative for Cortex R4 processors?
LikeLike
Hi Joel,
I cannot comment much about the R4, as I’m currently not using any R4 devices. Are you asking about SWO viewers or tools to get SWO data or in general about how to get data off the device? If you don’t know the Segger RTT, maybe this is what you are looking for? See https://mcuoneclipse.com/2015/07/07/using-segger-real-time-terminal-rtt-with-eclipse/ and https://www.segger.com/products/debug-probes/j-link/technology/real-time-transfer/about-real-time-transfer/. With this you only need a small piece of software on the device and you can stream in/out data through the debug interface.
I hope this helps,
Erich
LikeLike
Hi again!
Yes I was talking about a solution to get data off the device.
Actually yesterday I take a look at RTT, it compiled successfully and I am able to debug it on the device but I do not see any output using a telnel client (putty). If I use SystemView provided by SEGGER I get the error “cannot find RTT control block”, I followed the recommendations in the FAQ’s section in https://www.segger.com/products/debug-probes/j-link/technology/real-time-transfer/about-real-time-transfer/ but still no output.
After some searching I’ve read both opinions that this “is” and “is not” possible on the R4 (TMS570 specifically). Have you heard something about it?
Thanks a lot for your help!
LikeLike
Hi Joel,
“cannot find RTT control block” means it does not find that special memory block (https://www.segger.com/fileadmin/images/products/Feature_Explanations/Real_Time_Transfer/RTT_Schematics_Simple_tn.png) in the RAM of your device. That block is a variable with name _SEGGER_RTT. Check your linker map file if that variable is present in your binary. Maybe you did not call the RTT Inititalization and the linker has removed it?
If that _SEGGER_RTT is present, the Segger RTT client might look at the wrong place. The client uses your device name and knowledge where is the RAM of your device and scans that RAM. I have seen cases where that information was wrong, and the Segger RTT client did not search the correct areas. In the GUI client you can specify in the connection dialog where to look for that _SEGGER_RTT: specify the address and it hopefully will find it.
I hope this helps,
Erich
LikeLike
Any thoughts what could be the issue using SWO and an Atmel AT-ICE?
This debugger isn’t listed in Keil, however, it still works to download and step thru code, if I select “CMSIS-DAP”.
The default Trace settings even show SWO and ITM Enabled for all 32 bits of the ports, however, it’s all greyed out, so not sure if it’s legit.
However, if I manually enable in code, and send a character:
ITM->TCR |= ITM_TCR_ITMENA_Msk;
ITM->TER |= 1; /* ITM Port #0 enabled */
ITM->PORT[0U].u8 = (uint8_t)’A’;
I don’t ever see anything in Keil’s Debug (printf) Viewer. I have a feeling the debugger hardware supports it, and is an Arm configuration issue, or Atmel’s WinUSB.sys driver.
Any suggestions? I haven’t tried VisualGDB or Atmel Studio or Eclipse, since Keil 64K eval version is so convenient!
LikeLike
I understand that Keil is convenient for you, but have you considered to use unlimited and 100% free tools (see https://mcuoneclipse.com/2013/07/20/dyi-free-toolchain-for-kinetis-part-1-gnu-arm-build-tools/) based on Eclipse and GDB? If you use Keil, this is all based on proprietary stuff and you would need to ask their support. I have used Keil for a while too (not really any more).
LikeLike
Pingback: Overview of MCUXpresso IDE v10.2.0 | MCU on Eclipse
Thanks Erich for this very useful tutorial!
I have one question. Could you clarify?
Without connecting the J-Link tool, you can see any output on SWO line while probing it?
LikeLike
Yes. But there are two things you have to do:
– initialize the SWO to spit out the SWO data
– having someting on the host to get that data.
LikeLike
Pingback: New NXP MCUXpresseo IDE V10.3.0 Release | MCU on Eclipse
Pingback: SWO with NXP i.MX RT1064-EVK Board | MCU on Eclipse
Hello all,
is there a possibility to have a PC sampling based profiling in eclipse?
I used this feature in ke*l M*K and liked it very much.
Thanks a lot in advance!
LikeLike
Yes, there is gprof (see https://mcuoneclipse.com/2015/08/23/tutorial-using-gnu-profiling-gprof-with-arm-cortex-m/) and you can use SWO profiling (see for example https://mcuoneclipse.com/2019/06/03/swo-with-nxp-i-mx-rt1064-evk-board/).
I hope this helps,
Erich
LikeLike
Thanks for your quick reply.
How can this be done manufacturer independent?
I’d rather not use gprof to not change the memory and runtime behavior of the system.
A hacky and labour intense way could be to use the swo data from the segger swo terminal and to a address –> function lookup using some tool I don’t remember (help?)
How the raw data could look like is shown at the bottom of this thread:
https://www.silabs.com/community/mcu/32-bit/forum.topic.html/configuring_itm_for-7ek0
LikeLike
gprof would be vendor independent for sure, and I use it with stock eclipse too. You are correct that gprof affects runtime behaviour because of the sampling.
I’m using Segger SystemView https://mcuoneclipse.com/2015/11/16/segger-systemview-realtime-analysis-and-visualization-for-freertos/ to measure execution time too, but only for specific functions/places as I have to set marker in the code. Usuable for some hot spot optimizations.
Or you can dump all the SWO data as you have found in that article: the challenage might be to feed this data in a form to match the functions. Probably a script could do this based on the symbols of the ELF file.
LikeLike
When i’m using Segger SWO viewer, i need to input the TRACECLK frequency which supposedly is the same as my CPU frequency. If my HSE (external oscillator) is 8Mhz and my PLL is x9, my SYSCLK is 72Mhz – Is this the “CPU frequency”?
Or maybe there’s a more reliable to manually verify TRACECLK frequency in the code so I know what to put down in Segger SWO viewer? I am using STM32F302R8.
LikeLike
The MXUXpresso IDE has a ‘SWO detect clock frequency detection’ built in. Yes, in most cases the SWO clock is the CPU clock, and this would be the TRACECLK. The simplest way might be just to hook up an oszilloscope to the SWO pin to verify the actual clock speed.
LikeLike
To get ITM data out of Cortex-M processor, is single SWO pin enough? Or two pins, SWDCLK + SWO, are needed to make it work?
LikeLike
The SWO pin is enough.
LikeLike
Pingback: SWO with ARM Cortex-M33 | MCU on Eclipse
Pingback: Standalone SWO | MCU on Eclipse
Erich,
Thanks for this example, and many of your others they have helped me get many projects off the ground with Eclipse and ARM.
I have an interesting issue when trying to setup SWO using Eclipse, and was hoping to get your thoughts on it.
I have SWO working, and I am getting the printouts in Eclipse, but this only works after I open the J-Link SWO viewer. So if I program and run my project I do not see any printouts at all. If I open the SWO viewer while I have Eclipse connected via the J-Link I get the print outs in Eclipse (and not SWO Viewer) as expected. I have tried running the J-Link SWO viewer with both -swoattach 0, and -swoattach1 thinking that maybe when I was running it there was some configuration going on that Eclipse was not doing properly.
This is all with a Microchip AATSAME70N21 if that makes any difference (so Cortex-M7).
Not a huge deal, mostly just an annoyance, but any light you can shine on this would be greatly appreciated.
Thanks,
John
LikeLiked by 1 person
Hi John,
It is probably one of the ‘tool quirks’ you are running into. I faced the same until I initialized SWO in the application and not from any viewer. You probably have seen already my article about it on https://mcuoneclipse.com/2021/07/12/standalone-swo/. But the command line would be something like JLinkSWOViewerCL -swoattach on -swofreq 64000 -device LPC55S16 -itmport 0x1
LikeLike
Hi, thanks for the guide and code, really useful and helpful!
One note though, to get it working I had to change the check line 14 on one of your code snippets as below. It worked for me after doing this change. I believe this is correct because we are checking if the port is enabled, i.e. true?
Hope this helps someone 🙂
ORIGINAL
if ((ITM->TER & (1ul<TER & (1ul<<portNo))==1)
LikeLiked by 1 person
Thanks for your note. I’m not sure about that code piece you have posted, and most likely WordPress did not like the code characters (yes, it is painful)).
But I think it is about line 25 in https://github.com/ErichStyger/mcuoneclipse/blob/master/Examples/KDS/TWR-K64F120M/TWR-K64F120M_Demo/Sources/swo.c, correct?
That line checks if the corresponding bit in the TER (Trace Enable Register) is cleared, and if so, it returns. Sounds ok to me, unless I’m overlooking something?
LikeLike
Hi,
do you know what could be reason why the program goes to hard fault while writing to TPIU related registers like: Selected PIN Protocol Register or Async Clock Prescaler Register?
I’m not able to make the SWO running. Tried it by using j-link base or PEMicro debuggers. With S32 Design Studio IDE on S32K344 MCU.
LikeLike
Have not used the S32K for a long time. But I believe you first have to clock the TPIU first.
LikeLike
Hi thanks for the reply.
Actually my CORE_CLK is set to 160MHz, the TRACE_CLK is set to 80MHz – maximum TRACE_CLK could be is limited to 120MHz.
I’ve checked the registry and this shall be set correctly according to reference manual.
In case I want to configure debugger – I shall specify the CORE_CLK frequency or TRACE_CLK? And the same for the prescaler it shall be base on CORE or TRACE clock? However I’m still unable to set the prescaler and SPPR register (due to that hard fault). 😦
LikeLike
Can you check for the exact type of your HardFault? See https://mcuoneclipse.com/2012/11/24/debugging-hard-faults-on-arm-cortex-m/. Maybe this gives a hint.
LikeLike
Last few ASM instructions
ITM_init:004026a8: ldr r3, [pc, #52] ; (0x4026e0 )004026aa: movs r2, #2
004026ac: str.w r2, [r3, #240] ; 0xf0
004026b0: movw r2, #2499 ; 0x9c3
004026b4: str r2, [r3, #16]
004026b6: mov.w r3, #3758096384 ; 0xe0000000
004026ba: ldr r2, [pc, #40] ; (0x4026e4 )
004026bc: str.w r2, [r3, #4016] ; 0xfb0
My ITM_init function
void ITM_init(void) {
uint32_t SWOSpeed = 64000; /* default 64k baud rate */
uint32_t SWOPrescaler = (160000000 / SWOSpeed) – 1;
TPIU_SPPR = 0x2;
TPIU_ACPR = SWOPrescaler;
ITM_LAR = ITM_LAR_ACCESS; // unlock
ITM_TCR = 0x1; // global enable for ITM
ITM_TPR = 0x1; // first 8 stim registers have unpriv access
ITM_TER = 0xf; // enable 4 stim ports
DEMCR = TRCENA; // global enable DWT and ITM
}
LikeLike
Hey Jakub,
I am also facing the same issue,
Program goes to hard fault while writing to TPIU related registers
Did you get a solution ?
Btw: I am using XMC7100 (Cortex-M7)
LikeLike