With the cost of an single pin, many ARM Cortex-M boards including the NXP i.MX RT1064 can produde SWO data: think about a pin able to stream data out of the chip in realtime. For example interrupt activity which otherwise might be hard to capture:

SWO Interrupt Trace
Outline
This article describes how to enable and use the SWO (Single Wire Output) of the ARM Cortex-M7 present in the NXP i.MX RT1064 device.

i.MX RT1064-EVK Board
While this is a very valuable feature, not every development tool supports capturing SWO data. And not every board has the SWO pin routed to the debug header which is a prerequisite to get the data.

JTAG TDO Pin (Source: NXP i.MX RT1064 Schematics)
The pin is connected to the AD_B0_10 pin of the i.MX RT1064 device.
Software and tools used:
- Eclipse: NXP MCUXpresso IDE 10.3.1
- SDK: NXP MCUXpresso SDK 2.4.1 for i.MX RT1064-EVK
Check SDK Manifest File
💡 This step is only necessary for an older SDK as the V2.4.1 used in this article. I updated later on my SDK, and with the current one (at this time of writing: V2.6.1) the modification of the SDK is *not* necessary any more.
To use SWO, it has to be enabled in the SDK manifest file. So let’s check this first.
In the IDE, open the location where the SDK zip files are installed:

Open Location
💡 Best to close the IDE now, as we might need to change the content on disk.
Open the archive:
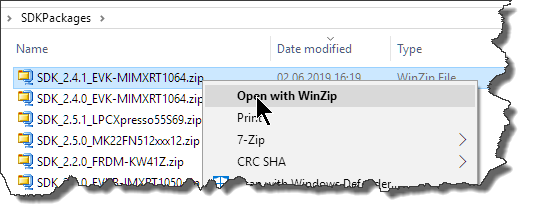
Open SDK zip file
Locate the manifest XML file:
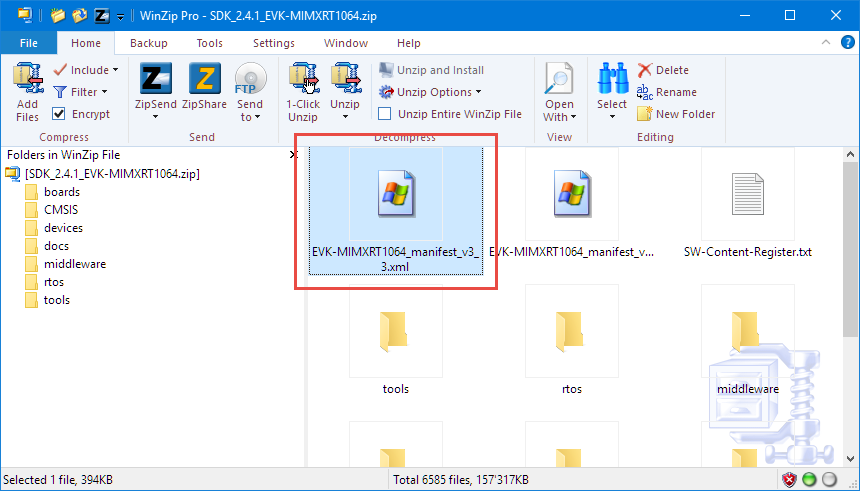
SDK Manifest File
To check/edit the manifext XML file I can use an external editor or the IDE:
Using the IDE
I can use the IDE to edit the XML (this is useful if I want to change the SDK sources).
To check/edit the file in the IDE workspace preferences, disable the ‘Selected files from SDK View open in read-only mode:
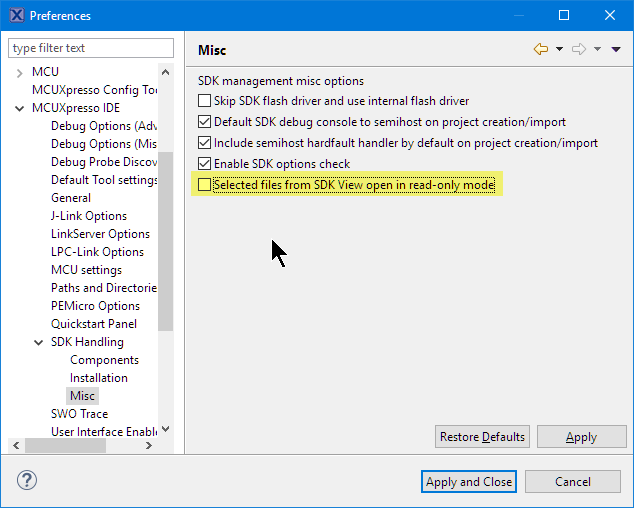
Selected Files Open Option
Open with the context menu the XML description:
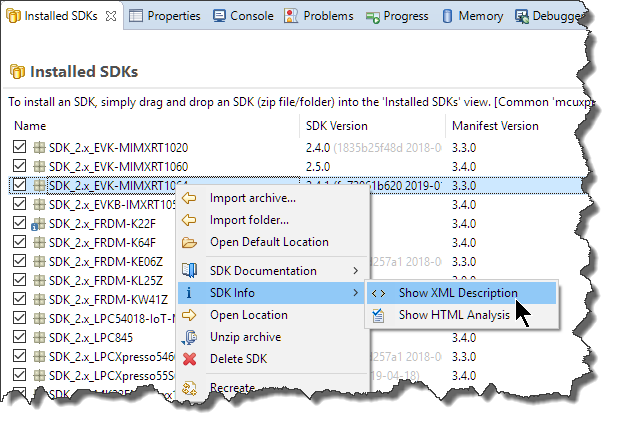
Show XML Description
In the XML editor, click on the ‘Source’ tab. Search for internal.has_swo:
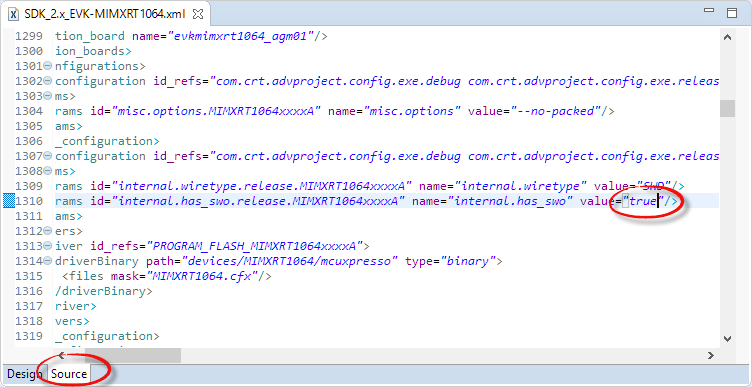
XML Source tab
Verify that it has a ‘true’ value. If not, change it to true and save the file.
Using external editor
Below are the steps using an external editor.
Open the file with a text editor and search for ‘internal_has_swo’ and check if it has a ‘true’ value. If not: change the value to true:

internal_has_swo
If that change is needed: update the zip file with the new content/file.
💡 if that setting is set to false, the IDE does not offer the SWO feature and buttons/views will be grayed out/disabled.
Now I can start the IDE again. If I had to modify the XML file, best to recreate the part information in the IDE:
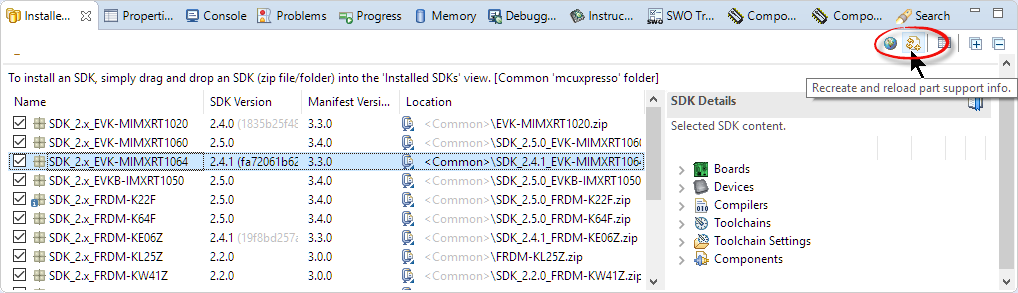
Recreate Part Information
Muxing SWO Pin
Locate the file ‘pin_mux.c’ and add the following lines to BOARD_InitPins():
IOMUXC_SetPinMux(
      IOMUXC_GPIO_AD_B0_10_ARM_CM7_TRACE_SWO,     /* GPIO_AD_B0_10 is configured as ARM_TRACE_SWO */
      0U);                                        /* Software Input On Field: Input Path is determined by functionality */
IOMUXC_SetPinConfig(IOMUXC_GPIO_AD_B0_10_ARM_CM7_TRACE_SWO,0x00F9u);

BOARD_InitPins
Open ‘clock_config.c’ and search for the following inside the function BOARD_BootClockRUN():
/* Set TRACE_PODF. */
CLOCK_SetDiv(kCLOCK_TraceDiv, 2);
/* Set Trace clock source. */
CLOCK_SetMux(kCLOCK_TraceMux, 2);
and change it to
/* Set TRACE_PODF. */
CLOCK_SetDiv(kCLOCK_TraceDiv, 0);
/* Set Trace clock source. */
CLOCK_SetMux(kCLOCK_TraceMux, 3);
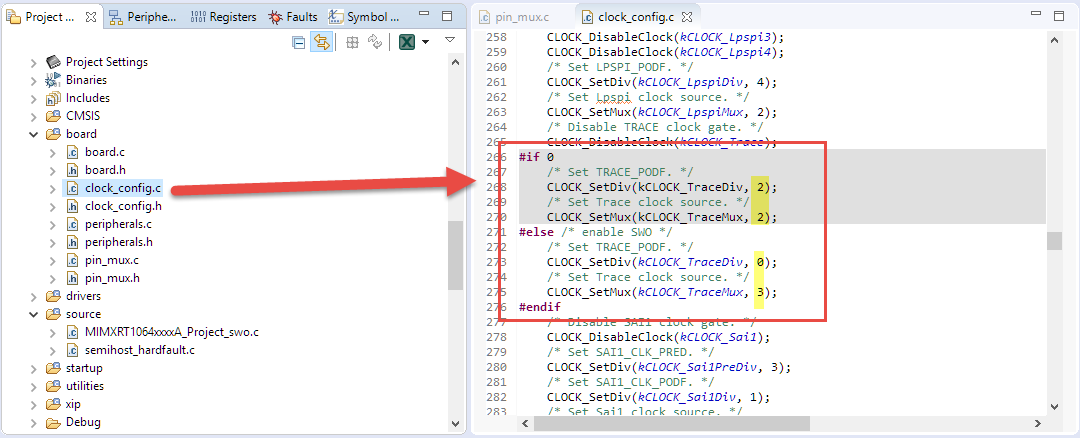
clock div and mux
Finally, add the following to the end of the function BOARD_BootClockRUN(), or add it to main() after the clocks have been initialized.
#if 1 /* enable SWO */
//*((uint32_t *)(0x400E0600)) = (1 << 11);  /* enable TPIU clock */
CLOCK_EnableClock(kCLOCK_Trace);
#endif
💡 That original code from NXP had the write to 0x400e’0600 in it which seems not to be correct, so I have taken it out.
Debugging
The onboard DAPLink debug probe does *not* support SWO, so I’m using an external debug probe (LPC-Link2). Alternatively, the EVK board can be loaded with a LPC-Link2 firmware.

Debugging i.MX RT1064 Board with LPC-Link2
In the SWO Trace Config view, the ‘change’ button shall now be enabled:
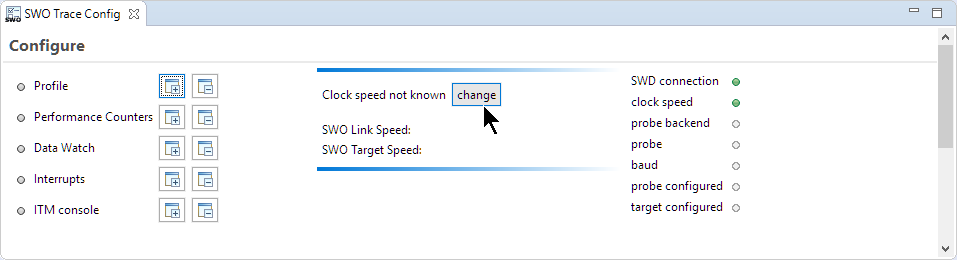
SWO Trace Config
Use the ‘Detect’ button to detect the SWO speed (note that for the application shall have already passed the clock configuration code):

Detect SWO speed
SWO Views
After this, I can open the various SWO views:

Open SWO views
The views have a green ‘start’ button to start data collection from SWO:
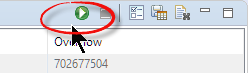
start button
SWO Counters view:

SWO counters
SWO statistical profiling:
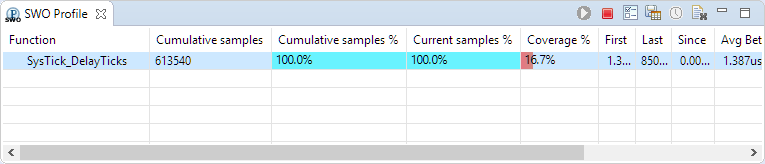
SWO Profile View
SWO Data Trace:
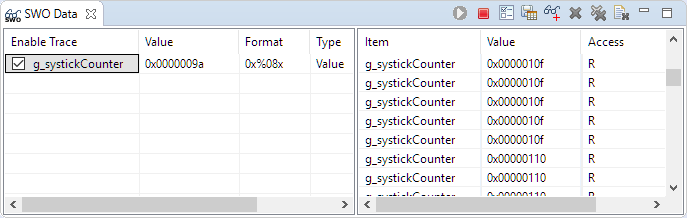
SWO Data Trace
Text output with SWO:

ITM Text Output
SWO Interrupt Trace:
SWO Interrupt Trace
💡 The IDE reveference manual/online help describes the views in more detail.
Summary
SWO on the i.MX RT1064 board is a fine thing: it requires some setup and a SWO capable debug probe. But with that extra ARM SWO pin I get extended debug views and data which are very valuable.
I have put an example project on GitHub (see Links section).
Happy SWOing 🙂
Links
- Project on GitHub: https://github.com/ErichStyger/mcuoneclipse/tree/master/Examples/MCUXpresso/i.MX%20RT1064_EVK/MIMXRT1064_SWO
- MCUXpresso IDE: http://www.nxp.com/mcuxpresso/ide
- MCUXpresso SDK: http://mcuxpresso.nxp.com/
- Using i.MX RT1060 with MCUXpresso IDE: https://community.nxp.com/community/mcuxpresso/mcuxpresso-ide/blog/2019/01/23/overview-of-using-the-mimxrt1060-evk-with-mcuxpresso-ide
- ARM SWO Performance Counters
- Tutorial: Using Single Wire Output SWO with ARM Cortex-M and Eclipse

Hello Erich,
is it possible to get the same trace output with a Kinetis MCU?
I’m using an MK26 in combination with the Segger J-Link. The SWO pin is routed to the J-Link.
The MCUXpresso IDE SWO TraceGuide says that with MCUXpresso V10.3.0 the J-Link can be used to do tracing.
Thanks,
Peter
LikeLike
Hi Peter,
yes, the same is possible with any Kinetis, i.MX or LPC devices which have the SWO pin routed to the debug header, with a SWO capable probe as the LPC-Link2.
LikeLike
Hello Erich,
thanks for this post and showing the advantages and value of having a working SWO trace in an IDE. I appreciate the density of information and the easy-to-follow style of your posts.
Is there a way of getting this nice representation for other vendors, meaning for another McuOnEclipse;)?
I would really love to see more generic solutions as vender specific / closed variants are already commercially available for quite some time.
shortly before arriving at the end of the internet, I found this post which seems very promising:
http://shadetail.com/blog/swo-the-hard-stuff/
is this of any interest to you?
LikeLike
Hi Peter,
I wish there would be more open solutions for SWO and trace on ARM Cortex-M. It seems to me that these features are only rarely used (not sure why?), the same time providing good support for it (configuration, getting/collecting data, visualize it) is a high effort. Which only some silicon vendors are willing to fund. With the MCUXpresso IDE I don’t feel looked in (it is free-of-charge, unlimited, and the only string attached is that it is for NXP devices only). We are using NXP devices anyway for most of our projects, the silicon is reasonable priced, and the superior MCUXpresso IDE makes it a logical choice we cannot complain about.
As for a vendor neutral solution: I’m using Sigrok (https://www.sigrok.org/blog/new-protocol-decoders-arm-tpiu-itm-etmv3) which is able to capture ITM/ETM/SWO data. Would be great if this would be intergrated into an IDE and linked to source code.
LikeLike
Pingback: New NXP MCUXpresso IDE v11.0 | MCU on Eclipse
Hi Erich,
thanks for this great writeup!
Do you have any documentation for this “*((uint32_t *)(0x400E0600)) = (1 << 11); /* enable TPIU clock */"? Neither in the reference manual, the Cortex M7 headers nor the ARM documentation I found anything about the address 0x400E0600. At least on my setup it seems to work fine without this line of code.
Do you use 600 MHz for the target clock speed as shown in the screenshot? When I use my J-Link EDU with the i.MXRT1021 it auto detects 500 MHz (it is the core frequency), but it only works if I enter the actual trace clock frequency.
LikeLike
I think I have found this in a forum somewhere, but indeed this could be a red hering. And I used that 600 MHz as in the screenshot, and that worked fine for me.
LikeLike
I just found again from where I had this 0x400E0600: it is from https://community.nxp.com/community/mcuxpresso/mcuxpresso-ide/blog/2019/01/23/overview-of-using-the-mimxrt1060-evk-with-mcuxpresso-ide
LikeLike
update: it seems that this write to 0x400E0600 is not intentional,so I have taken it out.
LikeLike
Hi Erich,
great write-up!
I do have one concern though:
Is this setup not violating the requirements for the TRACE_CLK_ROOT which according to the manual for the RT106x cores should be up to 132Mhz? Basically by selecting the clock source 3 and divider 0 (+1) that gets about the cpu clock which is in the region of 600Mhz. Granted that I understand that this change might be due to both the J-Link and Lpc-link 2 not properly supporting Cortex-M7 cores (where the trace module is no longer on the core itself and has a separate clock different from the cpu core) for SWO. In some cases, for instance for the J-link this can be fixed by implementing the SWO_GetSWOBaseClock function in a JLinkscript. This way I was able to use also the default setup (clock source 2, divider 2 which is around 117Mhz by default) when using the standalone J-link SWO Viewer but not much success yet when using the debugger with the MCUxpresso for instance.
LikeLike
I noticed the same thing about SWO data rate with a RT1062 target and a LPC-Link2 debugger probe. If forcing traceclk to something close to 600MHz then SWO works (and outputs 10Mbps on the pin). When using a supported trace clock rate (such as 132MHz) the data rate on the pin drops to 2.2Mbps. 600/132 == 10/2.2 so that definitely seems to indicate that the divisor is incorrectly calculated (based on the incorrect assumption that trace clock equals processor clock).
Further validation can be found by the register at address 0xe0040010 (the TPIU Asynchronous Clock Prescaler Register) which contains the SWO bitrate divisor (minus 1). In my case this gets set to 0x3b (a division by 60), which would have made sense for a 600MHz traceclk to give us 10Mbps, but 132M/60 results in 2.2M so that explains the incorrect bitrate I see on the SWO pin. Manually changing this register to 0x0c for a divide by 13 results in a bitrate of just over 10Mbps and the SWO viewer is happy again.
I wonder who calculates the value to be written to the TPIU_ACPR? It seems unlikely that it’s the actual debugger probe firmware so I assume that this is an issue on the host side.
Changing “Clock speed” in the SWO trace config dialog to 132MHz will actually produce good data, but only at half the rate (SWO link speed changes to 4.875Mbps) so that’s not a reasonable workaround for me.
LikeLike
Pingback: Getting Started with Microsoft Azure RTOS (aka ThreadX) | MCU on Eclipse
Pingback: New MCU-Link Debug Probe from NXP | MCU on Eclipse
Pingback: Debug Firmware Switching for the LPC4322 | MCU on Eclipse
Pingback: SWO with ARM Cortex-M33 | MCU on Eclipse
Pingback: Standalone SWO | MCU on Eclipse