
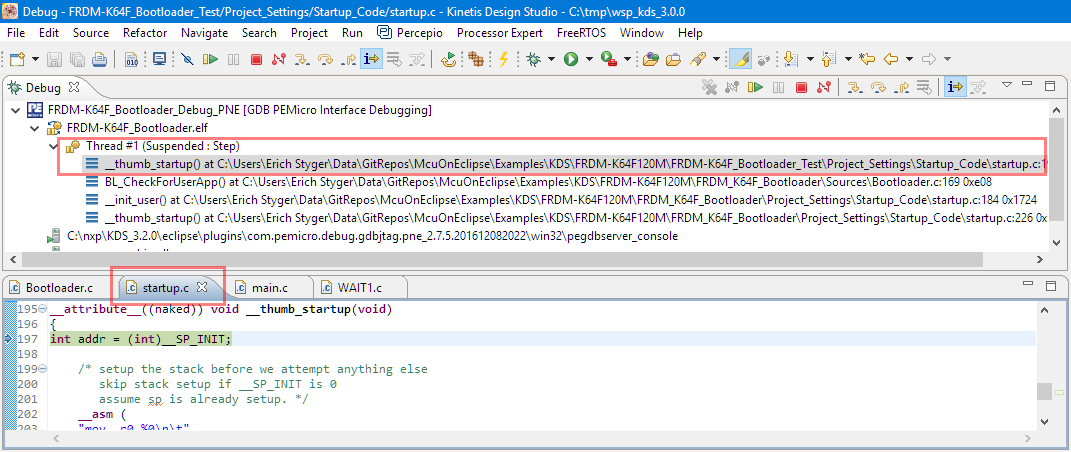
When working and debugging a bootloader, debugging can be a challenge: During debugging the bootloader, a new binary gets loaded into the microcontroller address space which is unknown to the debugger. As soon as I step into the newly loaded binary, I only see assembly code, with that ugly “No source available” in Eclipse:

No Source Available, debugging in assembly
But wait: GDB is able to do pretty much everything you can imagine, so here is how to debug multiple binaries with GDB and Eclipse, and to turn the above into something which is easy to debug:
Debugging with Symbolics
Outline
In many use cases, it is necessary to debug multiple binaries. One use case is with a bootloader (see “Serial Bootloader for the Freedom Board with Processor Expert“) or with using libraries (see “Creating and using Libraries with ARM gcc and Eclipse“). What is common in these cases that the debugger might not have the necessary debug information (or ‘symbolics’) do display the source files and the variable information.
Code and Debug Information
‘Debug information’ is embedded and part of the .elf (ELF) which usually has the DWARF debug information. When debugging a .elf file, that combined information is passed to the debugger, as shown below in the Eclipse launch configuration for GDB:
- Symbols file: this specifies which file is used for the debug information. The debug information is kept on the host and not downloaded to the target.
- Executable file: this file is used to download the code to the target. Only the code will be stored on the target.

symbols and executable information
As above, usually the symbols and executable file are the same, as the .elf file can contain both the code (elf) and the debug (dwarf) information. Unless debug information is removed (see “Debug vs. Release?“).
Adding Symbols
In the above setting, I have specified an executable and a symbols file. But how can I add more symbols for debugging? For example a bootloader loads an other executable or library. Or my microcontroller has a built-in library I need to debug?
What I need is that symbols or symbolic information. The easiest way is if I have that library (archive) or executable (.elf) with debug information. Then I need to tell the debugger (gdb) that extra information needs to be added.
💡 It is possible to generate files with symbolic information only (without the code) using the GNU tools.
The GNU debugger has the command
add-symbol-file filename address(see “GDB File Handling” for full description and other options) which adds extra debugging information the current debugging session.
For example I use the following command to add symbolic information in the Eclipse (or gdb) eclipse console:
add-symbol-file "c://tmp//FRDM-K64F_Bootloader_test.elf" 0x8200

Adding Symbols in GDB Command Line Session
This adds that set of other debug information to the information already present, allowing me to debug that code:
Debugging with Symbolics
Offset for the Symbols
You might wonder about that offset of 0x8200 in the command at the end:
add-symbol-file "c://tmp//FRDM-K64F_Bootloader_test.elf" 0x8200
That’s the offset of the .text section of the code I have loaded. In my bootloader example I load an executable with the vector table at 0x8000 and the code starting at 0x8200. The approach I’m using to determine that offset is to use the ‘readelf‘ program which is part of the GNU compiler suite. For example it is part of the Kinetis Design Studio too:
c:\nxp\KDS_3.2.0\Toolchain\bin\arm-none-eabi-readelf.exe -WS c:\tmp\FRDM-K64F_Bootloader_Test.elf
The -WS option dumps the symbolics (-S) in wide (-W) format: For the above case it produces the following:
There are 23 section headers, starting at offset 0x1354e8:

Section Headers:
  [Nr] Name              Type            Addr     Off    Size   ES Flg Lk Inf Al
  [ 0]                   NULL            00000000 000000 000000 00      0   0  0
  [ 1] .interrupts       PROGBITS        00008000 008000 000198 00   A  0   0  4
  [ 2] .text             PROGBITS        00008200 008200 000da0 00  AX  0   0  4
  [ 3] .ARM              ARM_EXIDX       00008fa0 008fa0 000008 00  AL  2   0  4
  [ 4] .init_array       INIT_ARRAY      00008fa8 008fa8 000004 00  WA  0   0  4
  [ 5] .fini_array       FINI_ARRAY      00008fac 008fac 000004 00  WA  0   0  4
  [ 6] .data             PROGBITS        20000000 010000 000060 00  WA  0   0  4
  [ 7] .bss              NOBITS          20000060 010060 000034 00  WA  0   0  4
  [ 8] .romp             PROGBITS        20000094 010094 000024 00  WA  0   0  1
  [ 9] ._user_heap_stack NOBITS          200000b8 0100b8 000400 00  WA  0   0  1
  [10] .ARM.attributes   ARM_ATTRIBUTES  00000000 0100b8 000030 00      0   0  1
  [11] .debug_info       PROGBITS        00000000 0100e8 002cbc 00      0   0  1
  [12] .debug_abbrev     PROGBITS        00000000 012da4 000c85 00      0   0  1
  [13] .debug_aranges    PROGBITS        00000000 013a29 0005c0 00      0   0  1
  [14] .debug_ranges     PROGBITS        00000000 013fe9 0004f0 00      0   0  1
  [15] .debug_macro      PROGBITS        00000000 0144d9 02f96a 00      0   0  1
  [16] .debug_line       PROGBITS        00000000 043e43 005026 00      0   0  1
  [17] .debug_str        PROGBITS        00000000 048e69 0eb25b 01  MS  0   0  1
  [18] .comment          PROGBITS        00000000 1340c4 000070 01  MS  0   0  1
  [19] .debug_frame      PROGBITS        00000000 134134 0012c4 00      0   0  4
  [20] .shstrtab         STRTAB          00000000 1353f8 0000ee 00      0   0  1
  [21] .symtab           SYMTAB          00000000 135880 000f90 10     22 182  4
  [22] .strtab           STRTAB          00000000 136810 000803 00      0   0  1
Key to Flags:
  W (write), A (alloc), X (execute), M (merge), S (strings)
  I (info), L (link order), G (group), T (TLS), E (exclude), x (unknown)
  O (extra OS processing required) o (OS specific), p (processor specific)
For the
add-symbol-file
gdb command the offset of the .text section is relevant:
  [Nr] Name              Type            Addr     Off    Size   ES Flg Lk Inf Al
  [ 2] .text             PROGBITS        00008200 008200 000da0 00  AX  0   0  4
With this I have the addressI can use with the command:
add-symbol-file c://tmp//FRDM-K64F_Bootloader_test.elf 0x8200
add symbol table from file "c://tmp//FRDM-K64F_Bootloader_test.elf" at
    .text_addr = 0x8200
(y or n) [answered Y; input not from terminal]
Reading symbols from c:\tmp\FRDM-K64F_Bootloader_test.elf...done.
With this, I’m able to debug the code loaded, because I have told gdb the debug information (line and debug information) is loaded at 0x8200.
Finding and checking symbol information
With the symbol information loaded, I should be able to debug that newly loaded code like normal code. I can use the gdb ‘info symbol’ command with an address to check which function is located at address 0x8254:
info symbol 0x8254
_start in section .text of c:\tmp\FRDM-K64F_Bootloader_test.elf
So gdb tells me that at the address 0x8254 the function _start() is loaded (based on the symbols I have provided).
Automating adding symbols
Instead of adding symbols interactively during the debug session, I can pass that information at debugger startup. Most Eclipse based GDB debuggers (including the NXP Kinetis Design Studio) have a setting in the launch configuration to pass commands and scripting to the gdb. Below shows an example with the GNU ARM Eclipse plugins:

Running GDB Command to load Symbols
I can add there any kind of gdb commands I like.
Summary
Typically all the debug information needed is in the binary under debug. But often the debugger has not all the information needed. In that case I can use gdb commands to add the necessary debug information and symbolics information. I can add this information during debug or I can automate things using the Eclipse launch configuration.
Happy Dwarfing 🙂
Links
- GDB file commands: https://sourceware.org/gdb/onlinedocs/gdb/Files.html
- GNU readelf: https://sourceware.org/binutils/docs/binutils/readelf.html
- GNU ARM Eclipse plugins: http://gnuarmeclipse.github.io/
- Serial Bootloader: https://mcuoneclipse.com/2013/04/28/serial-bootloader-for-the-freedom-board-with-processor-expert/

Thanks!
LikeLike
Pingback: Debugging Multiple Binaries in Eclipse with GNU Debugger « Adafruit Industries – Makers, hackers, artists, designers and engineers!
Thanks Erich! This is the second time today your blog’s given me just what I was looking for. This is one of those things that was more obvious in CodeWarrior. MCUXpresso or vanilla Eclipse can do just about anything, but they lack some of the discoverability that CW has – in this case you have to know gdb well enough to know that there’s a command that does what you want.
Is there an easy way to *load* two executables? I haven’t found an equivalent to CW’s ‘target task’ mechanism. I suppose I could probably go back to doing it like I did on the HCS08, with the linker including a binary.
I’m working on one of my weirder bootloaders at the moment. The only user-accessible input on the device is an audio input, so it takes audio firmware updates. Brings back memories of my Commodore VIC-20 – though the format’s more comparable to Acorn Computers’. Aside from the modem the bootloader’s pretty ordinary, but it’s slow to load so the fewer debugging runs I have to do, the better. Thankfully it doesn’t get updates very often, and the new Kinetis-based version will be able to update and configure via NFC (with NXP’s NTAG I2C parts) but I haven’t had time to work on an app for it yet, so it’s still audio for now.
LikeLike
The address passed into add-symbol-file should be the “Addr” not the “offset”. Address is the address on the microcontroller, offset is just the offset into the elf file. This caused me a bit of a headache when I went to try and replicate, the IDE was stopping at a nonsensical address (the breakpoint(address) I set, but not the breakpoint in the code that I set.
Anyways, in case anyone else has this issue…
LikeLike
Hi Raymond,
good catch! I just happend to me that both the offset and address were the same. I have updated the article, so thanks again.
LikeLike
Pingback: Debugging Bootloader and Application with one Debug Session | MCU on Eclipse