For a CubeSat project we only have a single board available. But multiple universities and developers need to have access to that board for developing and debugging the firmware. We cannot easily ship around the board: that takes a lot of time and during shipment nobody can use the board.
There is a nice feature in the Segger J-Link software which allows to share the debug connection over the network: the J-Link Remote Server. It even works nicely between different networks without complicated firewall setup:

Connected in Tunnel Mode
Outline
In this article I describe how to share a board for debugging with Eclipse, using the J-Link software and Eclipse with the GNU ARM Eclipse J-Link plugin.
I’m using the following versions (other versions or combinations do work as well):
- Host machine: could be Linux/Windows/Mac (I’m using Windows 10)
- Segger J-Link debug probe (any J-Link probe should work) with SWD/JTAG connection to the board
- Segger J-Link Software: V6.12g
- GNU ARM Eclipse J-Link Plugin: v4.1.2.201701141320
- Eclipse Kinetis Design Studio: V3.2.0
Segger Remote Server
To access the board from any other machine in the same network, I have to run the ‘Segger Remote Server’ executable on the host which has the board connected with a J-Link debug probe. With the IP address of the server host, I can use the board from the client host like a normal TCP/IP based debug probe:

Segger Remote Server
To run the Segger Remote Server, on Windows there are two binaries: a command line version (CL) and a GUI version.

JLinkRemoteServer Binaries
It directly connects to J-Link attached on the server host:
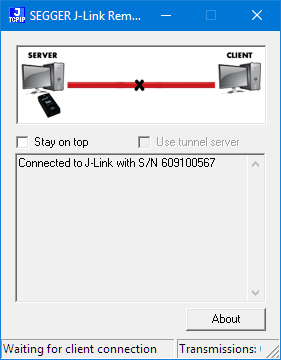
Segger Remote Server Waiting for Connection
Same thing if using the command line version:

Segger Remote Server Command Line Version
To connect to the server, I need to use the IP address of the server host (e.g. use ipconfig command on Windows):

ipconfig
Now all what I need to do from another machine to debug that board is to specify that IP address in the Eclipse Debugger launch dialog:
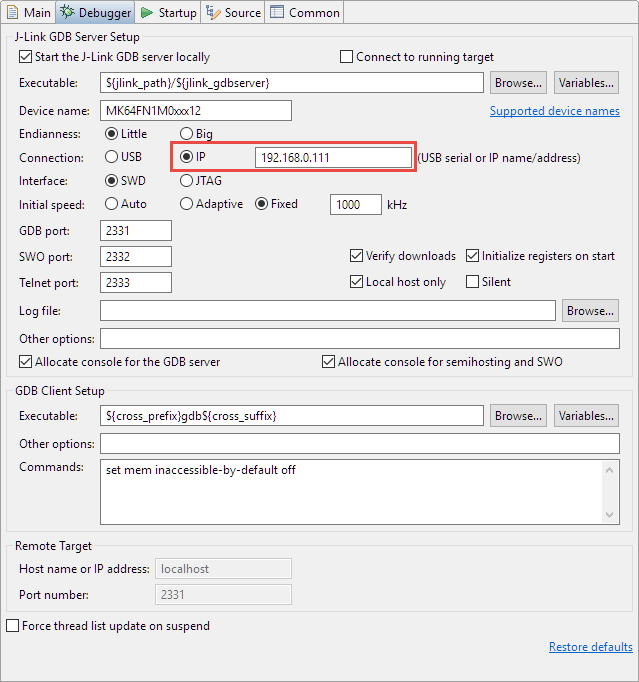
Segger Remote Server IP Address
So that way I can debug that board as I would have a TCP/IP enabled debug probe available :-).
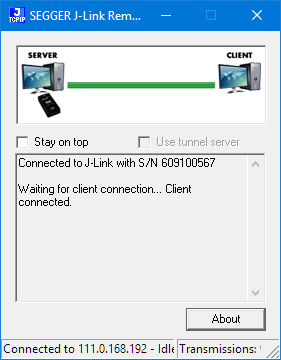
Client connected
Command Line Options
Both the command line version and GUI version accept some command line arguments:
Command line options:
UseTunnel     - Starts J-Link Remote Server in tunneling mode
port          - Select the remote port to listen on
SelectEmuBySN - Select the J-Link to connect to by its S/N
By default it uses the port number 19020. Using different port numbers I can run multiple Segger J-Link servers if I have multiple probes connected to the server host. For example I can use port 19021:
JLinkRemoteServerCL.exe -port 19021
With multiple Segger probes attached to the host, I can select it by the SelectEmuBySN option or in the dialog which offers to select the probe.
In the debug settings, I have to specify the port in the following way:
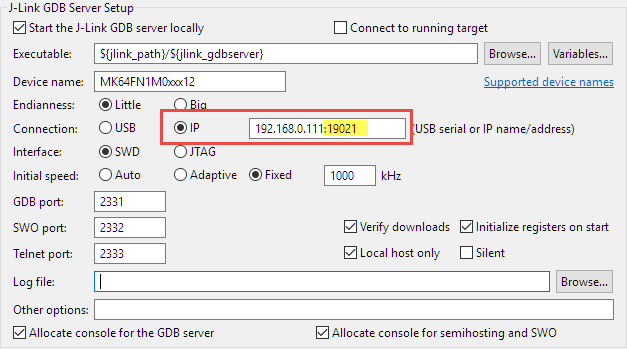
Port Specified for J-Link Remote Connection
💡 There is a bug in the current GNU ARM Eclipse plugin preventing to type in a colon (‘:’) for the IP address which I have reported (https://github.com/gnuarmeclipse/plug-ins/issues/177). The workaround is to copy/paste the address/colon.
‘Tunneling’ Mode
The above approach works if I’m in the same network and I’m able to connect to the server IP address. In the past I have used VNC, dyndns or VPN connections. But this is usually rather complicated to set up especially if I’m not the administrator of the network. An easier way is to use the ‘UseTunnel’ option:
UseTunnel - Starts J-Link Remote Server in tunneling mode
I can use that option like this:
JLinkRemoteServer.exe -UseTunnel
and it will start the server in tunnel mode. With this it connects to an external server at jlink.segger.com:
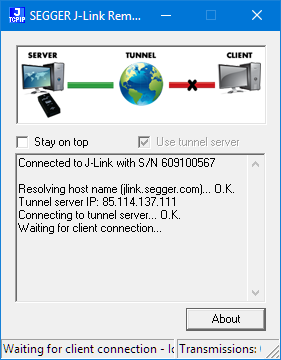
Segger Tunnel Server Connection
With connecting from the client host to the Segger tunnel server I can debug my board as it would be in the local network:

Segger Tunnel Server
For the connection from the client host I have to specify the Segger serial number:
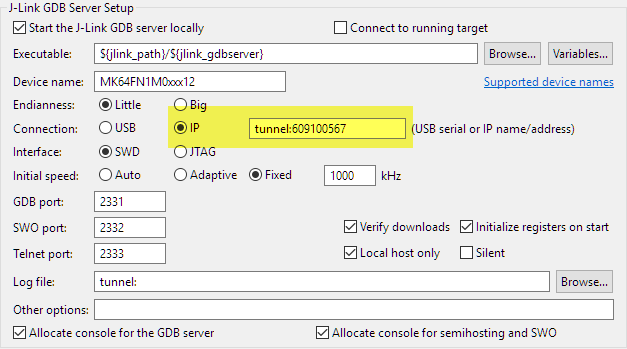
IP Connection with Tunnel
💡 If entering the ‘:’ does not work, use copy-paste until that issue is fixed in the GNU ARM Eclipse plugin.
That way I can debug the board through the tunnel:
Connected in Tunnel Mode
For me debugging through the tunnel is considerably slower, but works good enough.
Summary
With the GDB Remote Server software I can have a TCP/IP based debug probe and debug my board remotely with gdb and Eclipse. All what I need is a Segger debug probe, a host machine and the Segger Remote Server software running. With the tunnel mode it even works between networks and allows to share a board between remote developers. Of course this is not as good as having the board on the desktop, but better than to physically ship a board around.
Happy Tunneling 🙂
Links
- J-Link Remote Server: https://www.segger.com/jlink-remoteserver.html
- GNU ARM Eclipse Debugging: http://gnuarmeclipse.github.io/debug/

The remote server is in fact a very useful tool. We at SEGGER also use it in cases where
the silicon vendor does not have silicon they can ship, so we can make sure J-Link support
works 100% before even having an eval board on the desk. Also in cases where the customer experiences problems it can be quite useful, as we can debug into the problem instead of just
seeing it as we do with a remote desktop solution.
Happy tunneling! 🙂
LikeLike
Thank you for this post Erich.
For those who, like me, arrived on this post while searching how to connect the J-Trace directly to the debugging computer though Ethernet (which gives a faster connection than USB), you can achieve this by following this SEGGER guide : https://wiki.segger.com/Setting_up_Ethernet_interface#Setting_up_direct_connection_without_DHCP_to_the_host_PC.27s_Ethernet_interface
Which basically requires that you launch JLinkConf.exe and manually configure the IP address of your J-Trace. Give it an address that’s part of your local network and it should work perfectly. For network rookies (like me ) the reason is simply that the automatic IP attribution depends on a switch or router, which you don’t have since you’re directly connected to the computer.
LikeLike
Note that you can connect to the J-Link device using the serial number instead of the IP address:
JLinkGDBServerCLExe -if SWD -device STM32H743XI -select ip=12345678
The serial number is printed on the back of the device’s enclosure.
This works irrespective of the IP address assigned by the DHCP server.
LikeLiked by 1 person
But that would work only in the local network, right? Or do you have this working across routers or firewalls?
LikeLike
Hi Erich,
I think it only works within the LAN. My use case is to debug a device at the company I work for when working from home. I have VPN access to the company’s network.
LikeLiked by 1 person
Hi Emilio,
ok, that makes sense now. Thanks for that idea!
LikeLike
Pingback: Debugging ARM Cores with IP based Debug Probes and Eclipse | MCU on Eclipse
Pingback: Remote Debugging with USB based JTAG/SWD Debug Probes | MCU on Eclipse
Pingback: Black Magic Open Source Debug Probe for ARM with Eclipse and GDB | MCU on Eclipse