The previous parts were about installation, project setup and building. This one is about debugging an ARM Cortex-M Microcontroller with Visual Studio Code:
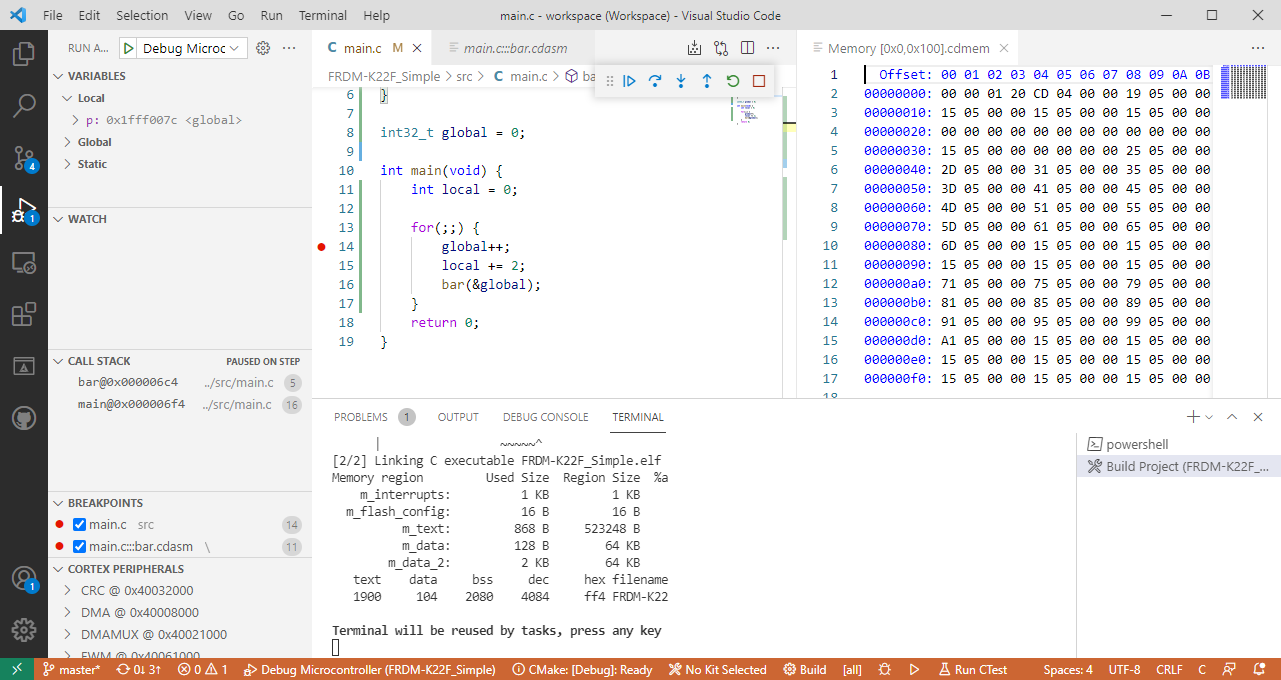
The previous parts were about installation, project setup and building. This one is about debugging an ARM Cortex-M Microcontroller with Visual Studio Code:
In “Freelink LPC4322JET100 based Debug Circuit on NXP i.MX RT1064-EVK Board” I described how to change the factory firmware from OpenSDA to the LPC-Link2 one.

Now it is possible to use a Segger J-Link firmware too, or to switch back to the factory default one.
Continue readingOne of the most frustrating part developing embedded applications is if the debug connection fails somehow: with all the different factors like operating system, virtual machines, USB ports and hubs, debug probe and firmware a ‘connection failed’ is my nightmare. And this is probably the most frustrating parts for my students (and myself!)
I do have a growing list of tips & tricks in “Debugging Failure: Check List and Hints“, so check this list. What I just have added is an entry for
java.net.SocketException: Connection reset
It occurred for a few students when they wanted to use the on-board CMSIS-DAP LinkServer debug connection on the NXP LPC845-BRK.
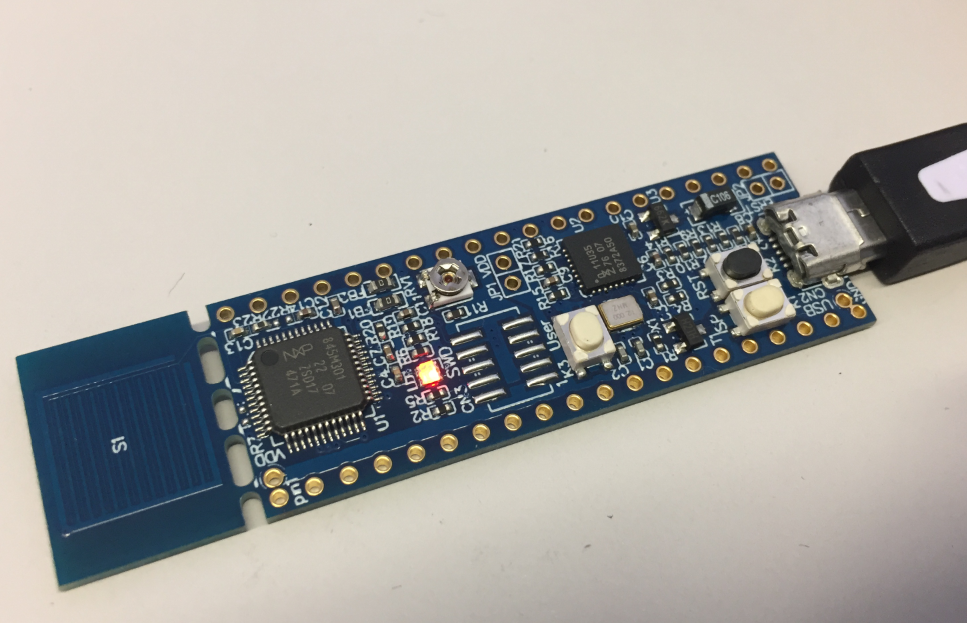
NXP LPC845-BRK Board
If you are developing Linux or desktop applications with GNU tools, you very likely are familiar with gcov: the GNU coverage tool. It collects data what parts of the code gets executed and represents that in different formats, great to check what is really used in the application code or what has been covered during multiple test runs.
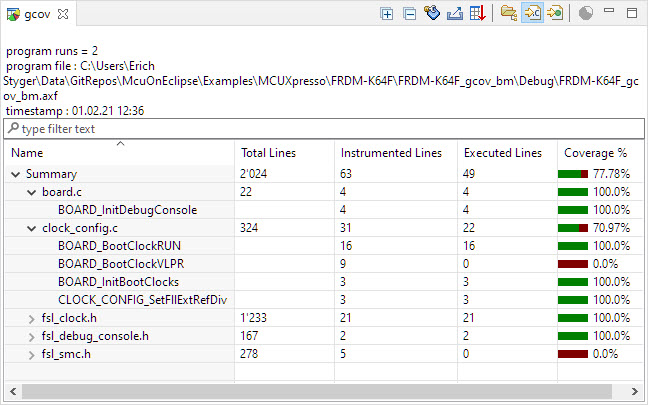
Coverage Information with gcov
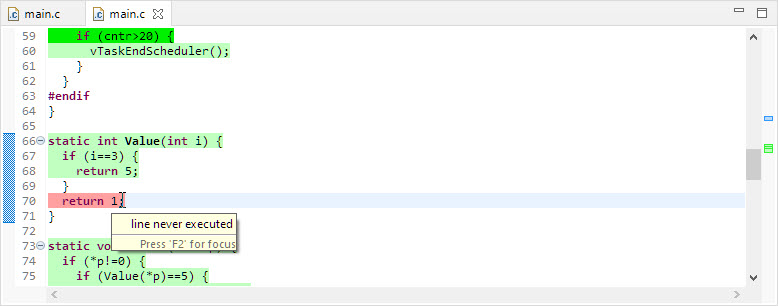
line never executed
GNU coverage is possible for resource constraint embedded systems too: it still needs some extra RAM and code space, but very well spent for gathering metrics and improves the firmware quality. As I wrote in “MCUXpresso IDE V11.3.0 for 2021” things are now easier to use, so here is a short tutorial how to use it.
It is always good to have a close look what ends up in a microcontroller FLASH memory. For example using EHEP Eclipse plugin to inspect the binary file:

Source File Name in Binary Image
Obviously it has path and source file information in it. Why is that? And is this really needed?
What about:
So let’s have a look what is the reason for this and how it could be avoided or at least reduced.
Something what I say quite often is: “Google is your friend”. It means that the answer to many questions can be found with an internet search engine. And I have to admit that I have to ‘google’ my own articles to find solutions for problems I feel I have seen in the past too :-).
But for the one problem below I did not find anything: not on my own blog, and not anywhere else in the internet:

Exception
I’m in the middle of the university exam season: means writing exams and do grading. The same time the new semester is approaching too and I need to prepare the new course material. For the classes using NXP parts I’m using the Eclipse based MCUXpresso IDE, and I just received the announcement that a new version V11.3.0 is available: time to check out what is new.
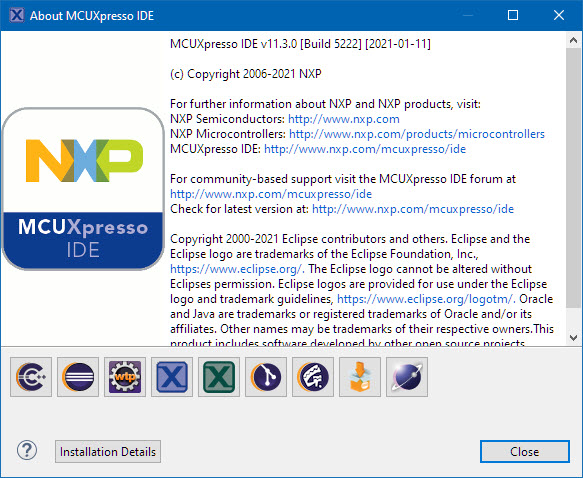
MCUXpresso IDE v11.3.0 (Build 5222)
Eclipse includes a background parser called ‘Indexer’ which is used to assist the developer with various kind of information, for example jumping to a variable declaration or definition. Basically it is a parser running in the background collecting information about the sources and building up that ‘index’ data base.
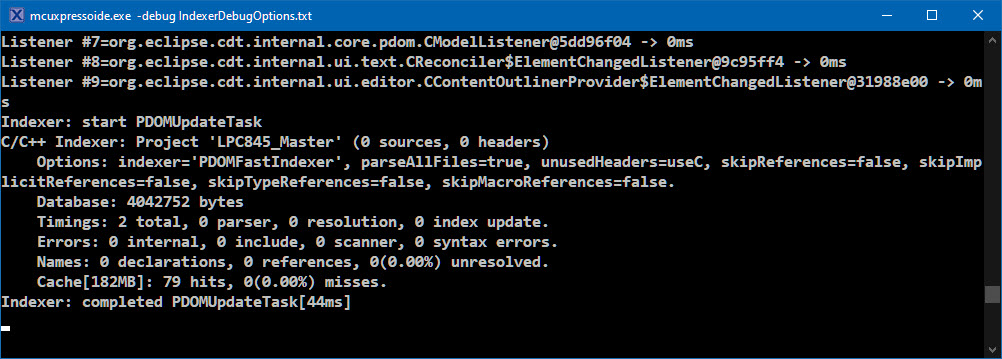
indexer debug output
The NXP MCU-Link is a powerful $10 debug probe for ARM Cortex-M devices and works with the NXP LinkServer for debugging. The LinkServer does not an implement a gdb server, so it limits its usage e.g. for scripting or command line debugging. But as MCU-Link is also a CMSIS-DAP compatible debug probe, I can use it with OpenOCD which is open source and implements a GDB server. This article shows how I can use it with the MCU-Link.

Debugging FRDM-KL25Z with MCU-Link
A very useful feature in Eclipse is Ctrl+Shift+L which lists all the available shortcuts:
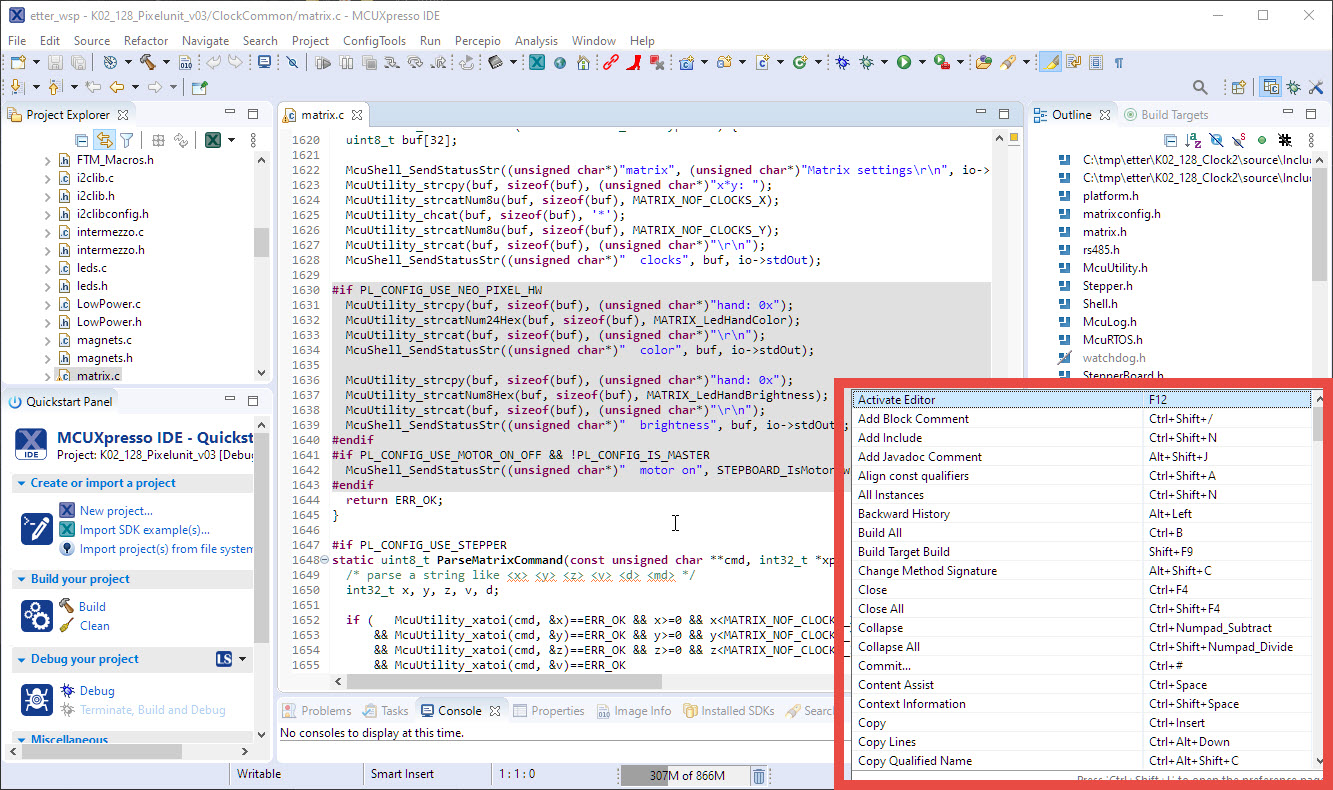
List of Shortcuts
Pressing Ctrl+Shift-L again will open up a dialog where I can configure them. But what if the shortcut or action is not listed there?
