
Eclipse includes a background parser called ‘Indexer’ which is used to assist the developer with various kind of information, for example jumping to a variable declaration or definition. Basically it is a parser running in the background collecting information about the sources and building up that ‘index’ data base.
indexer debug output
In case of problems, I recommend rebuilding the index:

Rebuild Eclipse Index
If this does not help, check the Indexer settings. I recommend unchecking ‘Allow heuristic resolution of includes’ especially for more complex projects:

Indexer options
Have a look to the ‘Paths and Symbols’ information: sometimes especially if a project has been copied or not properly configured it keeps orphaned entries which can be removed.

Paths and Symbols
Finally a debug log of the indexer could be helpful. For this create a text file with following content (e.g. IndexerDebugOptions.txt):
org.eclipse.cdt.core/debug=true
org.eclipse.cdt.core/debug/pdomtimings=true
org.eclipse.cdt.core/debug/indexer=true
org.eclipse.cdt.core/debug/parser=true
org.eclipse.cdt.core/debug/deltaprocessor=true
org.eclipse.cdt.core/debug/scanner=true
org.eclipse.cdt.core/debug/model=true
org.eclipse.cdt.core/debug/indexer/statistics=true
org.eclipse.cdt.core/debug/indexer/activity=true
org.eclipse.cdt.core/debug/indexer/problems=false
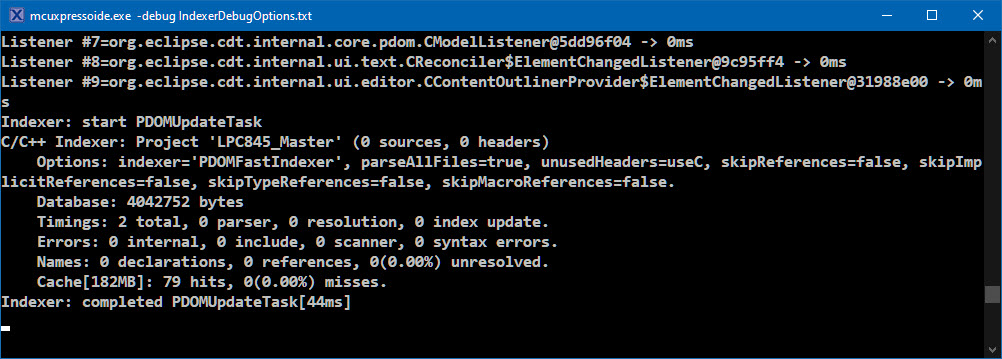
Then launch the Eclipse IDE from a console/command prompt with the -debug option pointing to that file (example for the NXP MCUXpresso IDE):
mcuxpressoide.exe -debug IndexerDebugOptions.txt
This produces a log to the console which can be helpful tracking down a problem:
indexer debug output
Happy Indexing 🙂

I don’t think it’s related but I wondered … on MAC MCUXpresso status along bottom there’s a section showing right now 440M of 1288M with a trash bin (that says run garbage collector); I’ve never seen it “finish”!
LikeLiked by 1 person
No, it is not related (at least not directly). It shows the heap status used by Java/Eclipse (https://mcuoneclipse.com/2013/11/04/show-heap-status-in-eclipse/).
Pressing the ‘garbage collector’ icon triggers the collector. I always have this one open to monitor how much memory is used, because older Eclipse versions were running into problems allocating more than 2GB of memory. In the recent years the Java/Eclipse developer did a better job not creating any memory leaks, but that information is still useful to me.
LikeLiked by 1 person
Pingback: Visual Studio Code for C/C++ with ARM Cortex-M: Part 6 | MCU on Eclipse