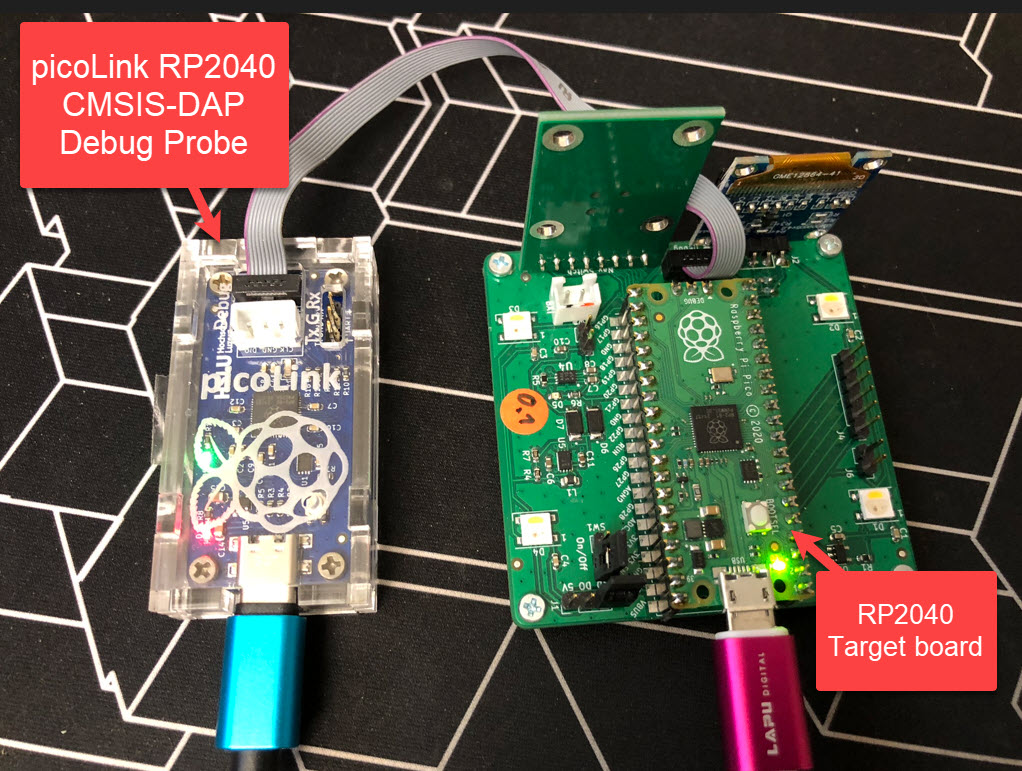
I love the WS2812B (aka SK6812) addressable LEDs: they are inexpensive and available in different packages. I have used them in different projects, including the MetaClockClock one. I used the NXP Kinetis for these projects, but because they are not available any more, for a new project we had to choose a new microcontroller, with the Raspberry Pi Pico RP2040 as the winner.
Raspberry Pi Pico RP2040 driving WS2812B with PIO and DMAContinue reading →
Most embedded developers have probably used ‘semihosting’. And yes, it is generally seen as a bad thing. Maybe you have used it, without realizing what it really is and what it does. It is simple to add a printf() to the code (again: you should not use printf), and with the right standard library, it magically it shows up in a console view:
printf a hello world
That looks great, but what is behind this, to make it happen? Actually, it is really amazing technology. And it can be used for better things than just printing text.
One of the biggest fears of embedded systems developers are stack overflows. FreeRTOS includes a cool feature to monitor and catch task stack overflows. But what about the MSP (Main Stack Pointer) on ARM, or the interrupt stack? What if not using an RTOS and running a bare-metal application?
Checking stack size used
There is a simple way monitoring stack usage at runtime, and for this I want to share the routines and what is now available inside the McuArm module.
If doing embedded development, then the debugging solution is probably the most important single tool in the development chain. Because very debugging probe has its pros and cons, I usually have at least three different debug probes on my desk, simply to get the job done in all aspects.
What is true for the hardware debugging probes, is true for the gdb client and server side. I’m using mostly the P&E, SEGGER and CMSIS-DAP plugins (e.g. NXP LinkServer) and OpenOCD from the Eclipse IDE side. But there are more choices, for example pyOCD.
The ARM Cortex M architecture has many features which are underused, probably simply because engineers are not aware of it. SWO (Single Wire Output) is a single trace pin of the ARM Cortex-M CoreSight debug block. trace pin uses the ITM (Instruction Trace Macrocell) on ARM Cortex. It provides a serial output channel, at a high speed higher than the usual UART, because it is clocked at half or a quarter of the core clock frequency, depending on the core and implementation.
As such, it is an ideal high speed output channel to send text or data to the host. This is how it is usually used, but what is unknown to many: it can be used in a bidirectional way with the help of the debugger.
The topic of this article: how to redirect standard I/O like printf() or scanf() using the SWO ITM console: means both sending *and* receiving data over the SWO debug channel: that way I can use it as a kind of UART with a single pin only.
A typical debugging session involves just one ELF/Dwarf binary or executable. But what if I need to program multiple binary files with gdb? Things like loading both the bootloader and the application binary? Or I have a an on-chip file system or data section I need to program?
In this article I show how I can use gdb to load and program extra data, like a binary (.bin) file, both using command line interface and using an IDE.
In Getting Started: Raspberry Pi Pico RP2040 with Eclipse and J-Link I used a SEGGER J-Link EDU for debugging: unfortunately, probably because of silicon shortage, these EDU probes are out of stock everywhere. Luckily, there is a solution: just use another Raspberry Pi Pico!
SWD Debugging with PicoProbe
This turns a $5 Raspberry Pi Pico board in to a very usable and versatile debug probe.
MCU vendors offer SDKs and configuration tools: that’s a good thing, because that way I can get started quickly and get something up and running ideally in a few minutes. But this gets you into a dependency on tools, SDK and configuration tools too: changing later from one MCU to another can be difficult and time consuming. So why not get started with a ‘bare’ project, using general available tools, just with a basic initialization (clocking, startup code, CMSIS), even with the silicon vendor provided IDE and basic support files?
In this case, I show how you easily can do this with CMake, make and Eclipse, without the (direct) need of an SDK.
In this time where many micro-controllers have 100+ weeks estimated delivery time, it makes sense to look at alternatives. So it is not a surprise that the Raspberry Pi RP2040 gets used more and more in projects. It is not only inexpensive, it is (at least for now) available which makes all the difference. The RP2040 is the first microcontroller from Raspberry Pi: a dual-core ARM Cortex-M0+ running up to 133 MHz, 264 KByte on-Chip RAM and up to 16 MByte external FLASH.
Raspberry Pi Pico with J-Link, with a NXP sensor board
It is a very versatile microcontroller, with a rich eco-system and set of tools. It can be easily used with C/C++ or MicroPython, and the Raspberry Pi Pico board only costs around $5. There are plenty of tutorials out there, for example how to use the Pico board as debug probe to debug another Pico board. While this is great, there is an easy way to use any existing J-Link and Eclipse IDE too, so this is what this article is about.