With semihosting I can use standard I/O function like printf() and I can read and write data on the host through the debug connection. If used with care, this is a great feature especially for unit testing.
I have lots of hardware and debug probes on my desk, and I discussed using nicknames for debug probes to better identify them.
‘Green’ and ‘Yellow’ Robots and J-Link Probes
So far so good. At that time of the previous article, it was possible to assign nicknames to J-Link debug probes, but not to use the nickname instead of the USB serial number. Well, SEGGER was fast again, and responded with a new J-Link software pack version 7.92d which implements that features: I can now use the nickname to connect to a debug probe :-).
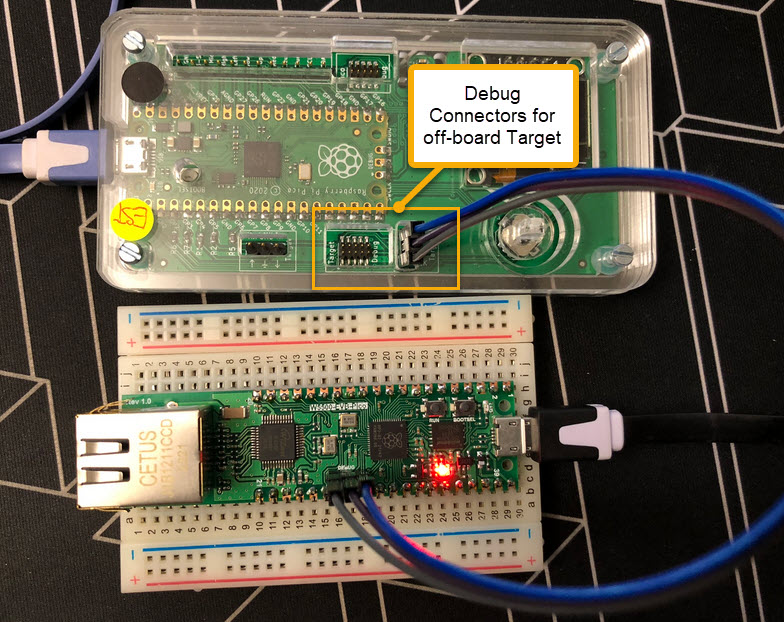
Sometimes I have a wish. Not every time it gets fulfilled. But this time I’m lucky and happy developer. A few days ago I wrote about the LPC4322-based SEGGER OB (on-board) J-Link firmware. It works great, but the board requires another USB cable to power the target board.
Rolf Segger contacted me, and a few days later I had a J-Link firmware with a ‘power-on’ feature:
That way, only one USB cable is needed. All what you need to do is to update the firmware.
Going with the factory default can be fine. But an upgrade could give a performance boost plus added functionality. Many of the NXP i.MX RT evaluation boards have an LPC4322 based debug circuit on it. One example for this is the i.MX RT1010 board.
NXP i.MX RT1010 EVK
On such boards, one of the first steps I do is: upgrading the firmware and change it to a better option: improved speed, SWO support plus avoiding issues with the USB MSD device.
But I did not had enough time to replicate this for a full set of classroom hardware. The original card boxes from NXP showed already after one semester severe wear, so I have to setup something more robust: a box to store all the cables, and an enclosure to protect the PCB, for 40 units.
3D printing would take to much time, so I ended up with buying storage boxes and creating an laser-cut acrylic (PMMA) enclosure for the debug probe itself:
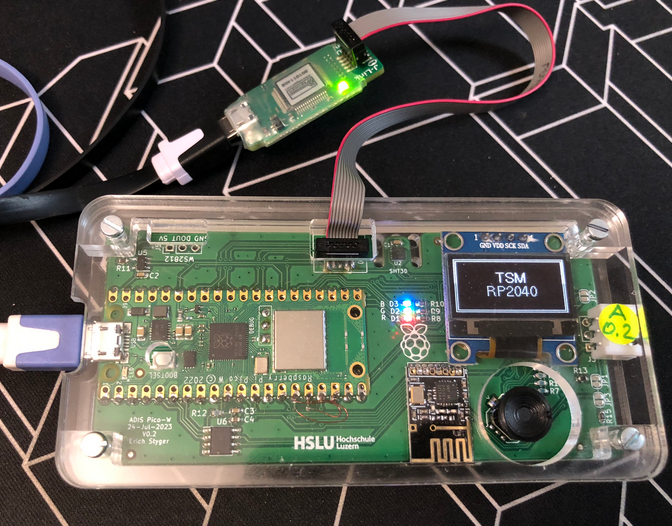
Dealing with and debugging distributed systems, I end up with multiple debug probes and target boards on my desk. When starting a debugging session, it can be hard to identify a debug probe by its serial number. What I do in such a situation: put a color stick on the debug probe and have it assigned a nickname.
Debug Probes with Nicknames
That nickname then shows up during the debug connection, and I’m sure I connect to the right probe and board that way.
Don’t worry: despite all the things going on with VS Code, Eclipse is here to stay probably for many more years. The Eclipse foundation is pumping out releases, and so does NXP with their latest MCUXpresso IDE 11.8.0. Lets have a look…
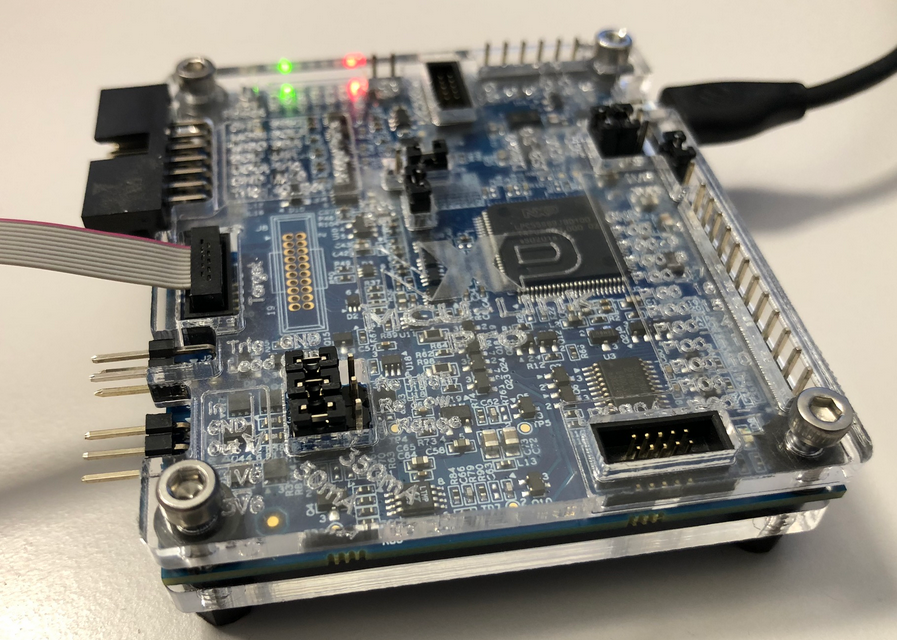
It is August 1st, and Switzerland is celebrating its National Holiday. Rather cold and rainy, so this gets me some time to catch up on things. The preparation for the coming university semester in September is in full swing, and I have the honor to take over building up a new Master of Science in Engineering education module. In the existing courses I teach on the topic of embedded systems, I do use devices and MCUs from vendors like Broadcom, NXP, STM, Nordic, Raspberry Pi and Espressif. This not only means different SDKs, but different IDEs with different debug probes.
Just a subset of different hardware kits used in different labs
Eclipse has been the common factor in the mix with all these, and with all the pros and cons, it worked very well. With NXP having released support for Visual Studio Code, adding an announcement, and other vendors going into the same direction, I took the decision that I want to migrate my lab and lecture infrastructure to VS Code.