FreeRTOS has a great performance measurement feature built-in: Performance counters. At each context switch, the RTOS can do a bookkeeping of time spent in tasks. With this, it can estimate the runtime distribution between the tasks. A very useful feature to get a feeling what the tasks are doing.
But I noticed that with recent FreeRTOS versions, VS Code extension have issues showing the correct runtime counter values:
Unknown Runtime Counters in VS Code Extension (mcu-debug.rtos-views)Continue reading →
This is the second part describing how to use DevContainer for embedded applications with VS Code.
In Optimizing Embedded Development with VS Code and DevContainer I use VS Code with a docker ‘development’ container. The container is created with a recipe to install the development tools and SDK. With VS Code and DevContainer I have the same developer experience as I would develop locally on the host.
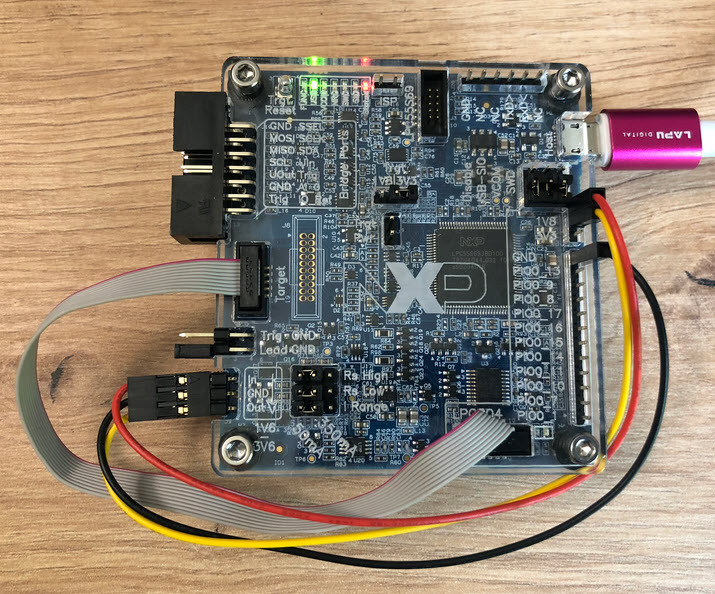
One thing not addressed in that earlier article is debugging. Using USB debug probes like a SEGGER J-Link or NXP MCU-Link is a challenge inside a container. This applies to any other debug probe as well.
The solution is to transform an USB based debug probe into one with a network connection:
NXP has released a new LinkServer software. It includes an interesting feature. The LinkServer test runner has been extended with a Semihosting console. This is not only very useful for on-target testing. With the Semihosting console, I have a bidirectional communication channel with the target. And I do not need any hardware pins or to run a debug session. All what I need is the CMSIS-DAP connection with the NXP LinkServer runner to have a command line shell:
NXP has released a new version of the LinkServer software. This is a utility for debugging and using scripting for a wide range of devices and debugging probes. It includes support for the MCU-Link, LPC-Link2, on-board and CMSIS-DAP based debug probes with the ‘LinkFlash’:
Programming with LinkFlash
With the new release, it includes a graphical user interface (GUI) for flash programming. It also includes erasing, verifying, recovery, and saving the memory to a file.
There is a new feature in the SEGGER SystemView: the ability to plot any data provided by the application, for example sensor data or any other useful data:
The GNU Coverage (gcov) is a source code analysis tool, and is a standard utility in the GNU gcc suite. It works great in a hosted environment (e.g. Linux or Windows), where you have plenty of resources and a file system. But the gcov tools is relevant and usable for restricted embedded systems too. I have used it for years with the help of debug probes and file I/O semihosting. But semihosting does not come for free, depends on a library with support for constructors and destructors, plus relies on file I/O.
Fortunately, there is a way to use gcov without debugger, semihosting, file I/O and special system initialization: using a freestanding environment:
gcov in freestanding environment with embedded target
This article explains how to collect coverage information using a data stream for example over UART or USB-CDC. Key benefits are less code side, no need for a debugger or on-target file system, improved performance, better automation and flexible data collection.
A new eclipse-based NXP MCUXpresso IDE v11.10 is available With this new release, it includes an even easier firmware update mechanism for the MCU-Link (LinkServer) debug probes.
The NXP i.MX RT685 is an interesting device: an ARM Cortex M33 with a Cadence Xtensa audio DSP. To explore the features of the device, I’m using the NXP EVK board:
pyOCD with NXP i.MX RT685
I have used it so far with the on-board MCU-Link debug probe and LinkServer. This article describes how I have added pyOCD as debug interface for the RT685, as well how to patch and use custom DFP (Device Family Pack) files with pyOCD and Eclipse.
Europe is currently facing an ‘Energy Crisis,’ and ‘Sustainability’ is a popular topic among companies. However, embedded engineers go beyond talking—they take action and make tangible changes in the world. With the increasing use of electronic devices, minimizing their energy and power consumption is crucial. Optimizing systems for deep low power or deep low energy is a challenging task. Nonetheless, as I will demonstrate in this article, it is possible to reduce energy consumption by a factor of 100 or more. This article provides a brief overview of the foundational concepts and then applies them step-by-step to an ARM Cortex microcontroller.
This week I have received the new PCBs for the MCU-Link MR for drones and robots and have populated the parts on the PCB, and it works fine as UART bridge and debug probe for the PixHawk i.MX RT: