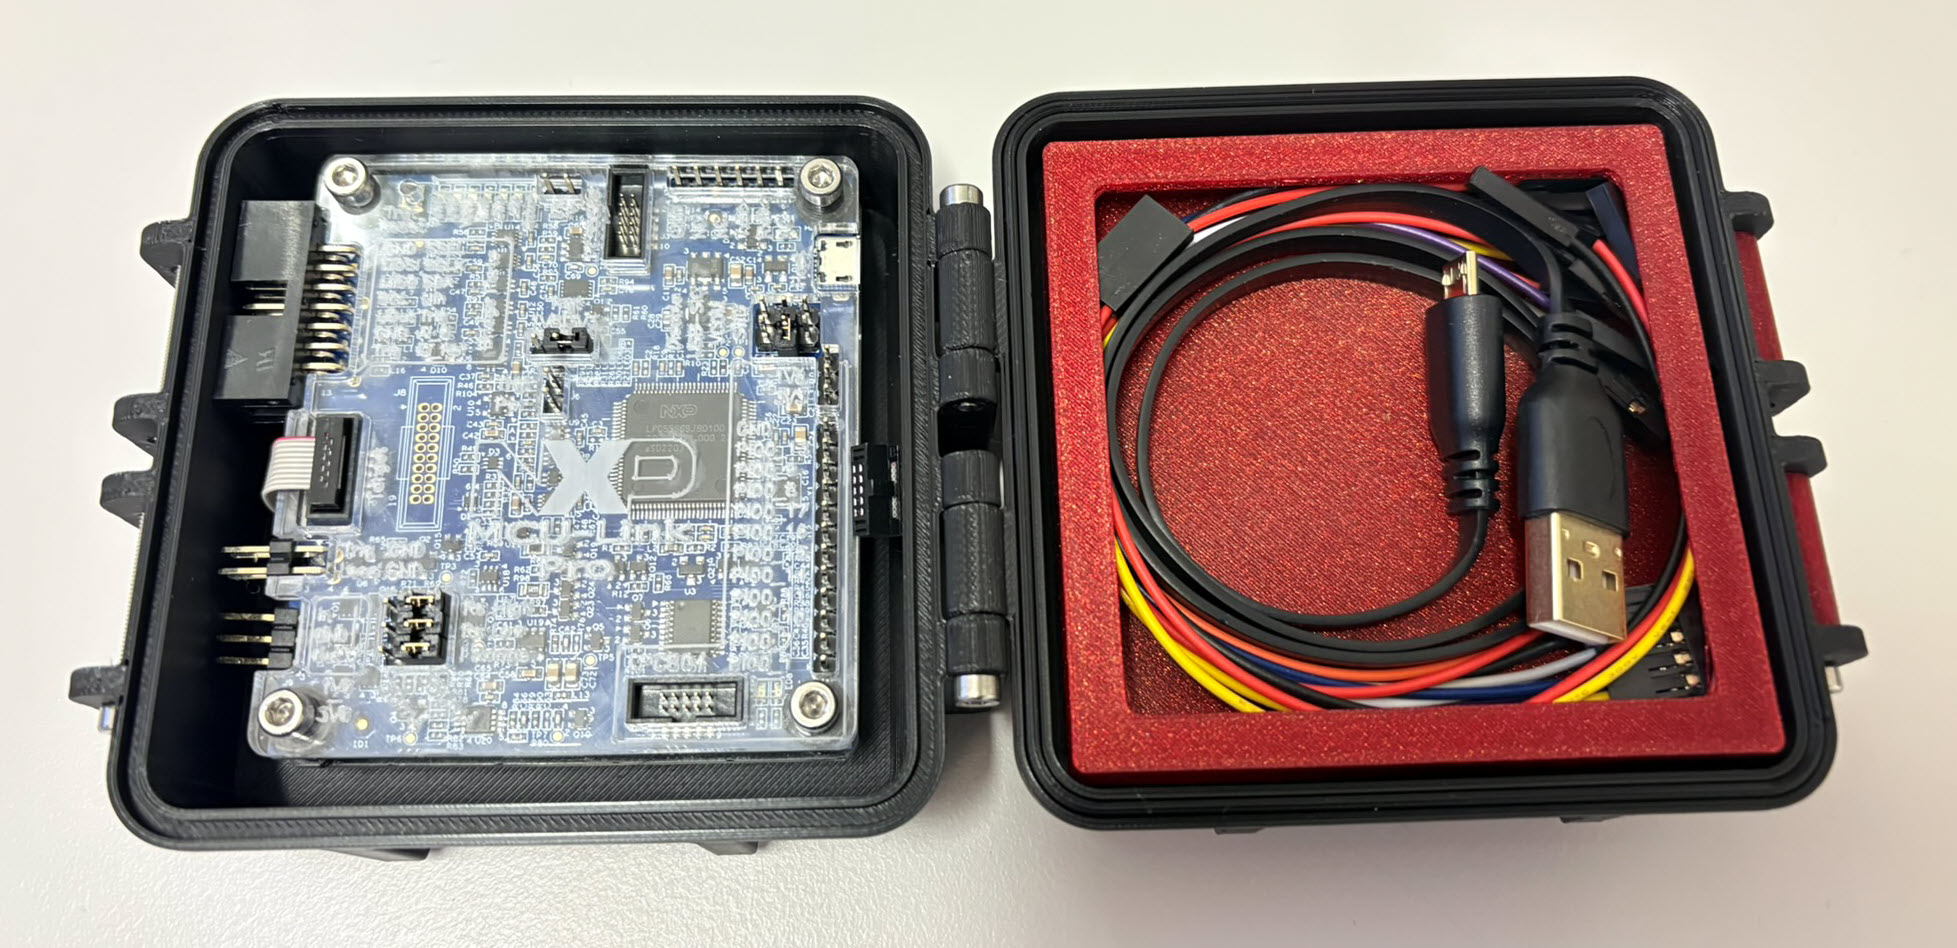
I’m using the NXP MCU-Link CMSIS-DAP debug probe in many of my projects. The debub probe from NXP does not come with an enclosure. I’m traveling to work by train, so I designed a new rugged box and enclosure. The box is small and I can keep all parts inside it.
Rugged boxes and enclosure for NXP MCU-Link debug probesContinue reading →
Sometimes, all what I have is a ELF/Dwarf binary, and I need to debug it. I don’t want to build it, only debug it. The NXP VS Code extension makes that possible. I simply import the binary and start debugging.
Today’s projects and systems get more and more complex. Many systems include multiple MCUs, connected with a field bus or network, for example CAN. For example there can be up to 70 CAN nodes in modern cars. Such larger and connected systems are a challenge for debugging.
Traditional hardware debugging requires a hardware debug probe, connected with a dedicated SWD/JTAG debug cable to the target device. This needs dedicated pins on the target device plus physical access to the device itself. In many cases, this is not possible in the final product. The hardware debug probes, cables, pins and high speed signals are costly. And worse they can introduce new problems and are prone to interference.
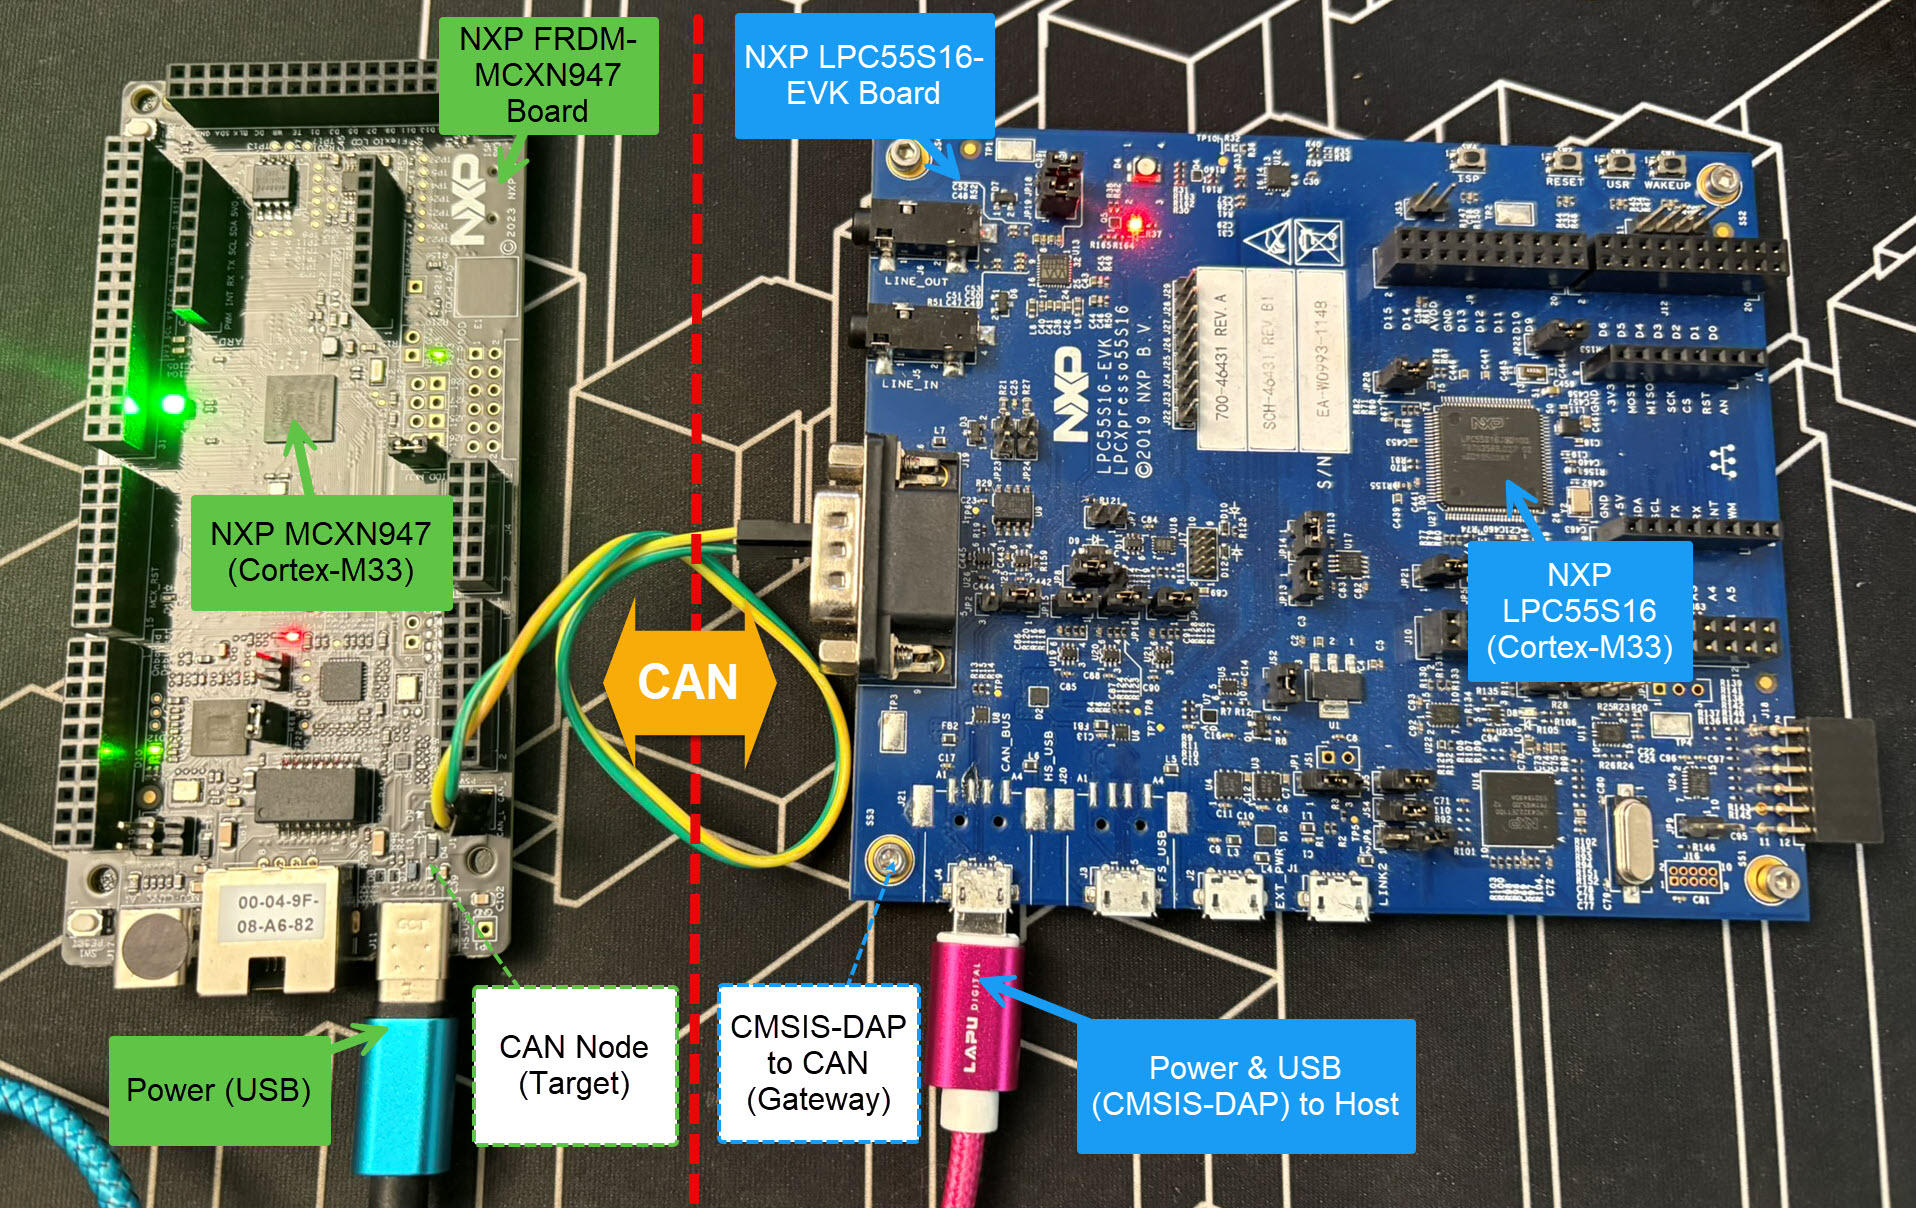
If there is a field bus like CAN connecting all the MCUs, why not use it for hardware debugging? Hardware debugging meaning programming the FLASH memory, halt the MCU, inspect the memory and registers, and step through the code?
Cortex-M Hardware Debugging over CAN
Yes, we can! With the help of a rather unknown hardware feature on ARM Cortex-M devices. We can use the ARM DebugMonitor Interrupt to control and debug the target system. As we would use a JTAG/SWD connection. Instead, we use the CAN bus :-).
Usually, I run applications in the micro-controller FLASH memory. But for a CI/CD or testing environment that is not the best choice.
It is possible to have a ‘RAM target’, where the application is running in RAM instead of FLASH memory. This has the advantage not to ‘wear-out’ the FLASH memory. Plus loading and running in RAM is faster. This makes having RAM targets especially useful for testing.
In this article I’m using the NXP LPC55S16-EVK board, but any other target or board is applicable.
Remote debugging an embedded target is very useful: I don’t need a direct debug probe or USB cable connection. Instead, I’m using a network connection (wired or even wireless) over TCP/IP to talk to the debug probe and target. That way I can place the debug probe and target system away from my desk.
In Remote Debugging with USB based JTAG/SWD Debug Probes I showed how normal USB based debug probes can be used. This approach uses a remote host machine (e.g. desktop machine or notebook). This approach is still expensive, not scalable and the host machine needs a lot of space too.
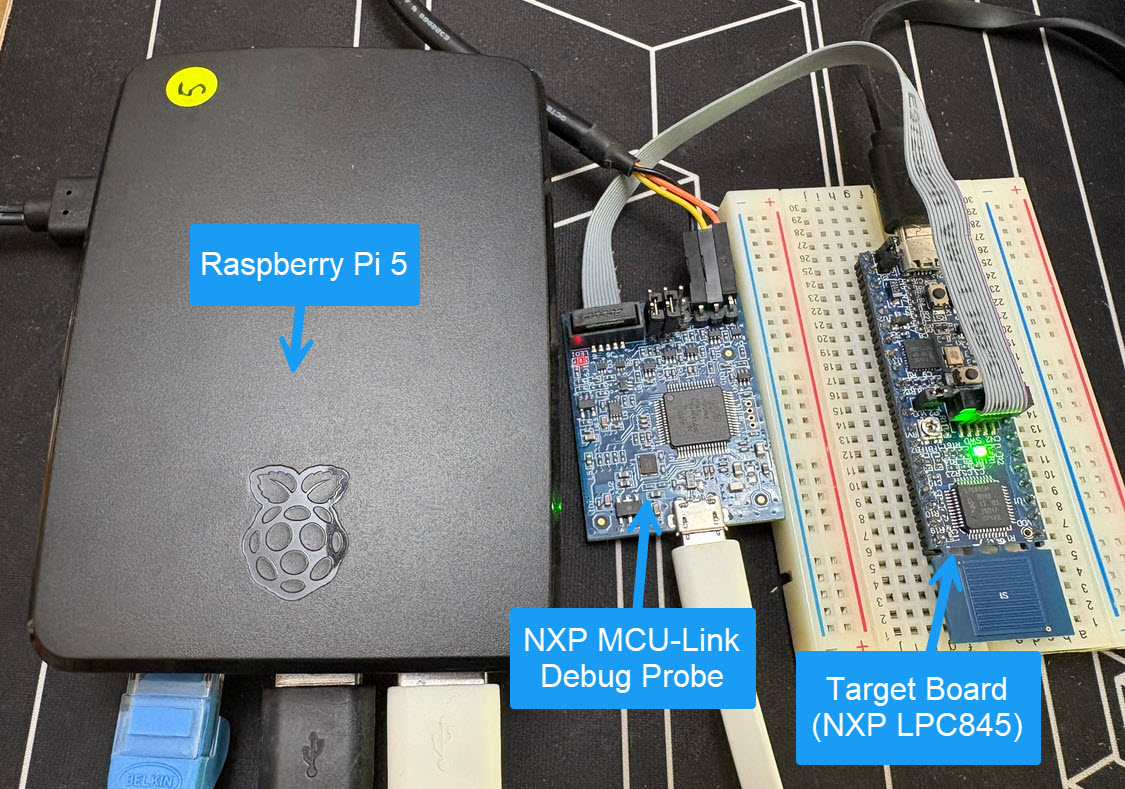
So what if I use a Raspberry Pi instead? The RPi is small, inexpensive and ideal for such a task. Additionally, I can easily use it to build a test or debug farm. In this article, I show the use of the Raspberry Pi for remote debugging. A sub $20 or embedded target debug probe can be employed.
Raspberry Pi with NXP MCU-Link for Embedded Target DebuggingContinue reading →
The MCU-Link-MR from NXP is a CMSIS-DAP debug probe. It includes dedicated connection headers found on mobile robotic systems. These systems include the Pixhawk/PX4 drone and robotics hardware.
The NXP SDK is git based which is great. If I create a project with VS code, it references the SDK cloned locally.
Standard NXP SDK Project in VS Code
A standalone project structure is needed if you want to easily share a project with your team. It’s also necessary for sharing inside a classroom environment. This article shows how to use an NXP SDK project in standalone mode.
This is the second part describing how to use DevContainer for embedded applications with VS Code.
In Optimizing Embedded Development with VS Code and DevContainer I use VS Code with a docker ‘development’ container. The container is created with a recipe to install the development tools and SDK. With VS Code and DevContainer I have the same developer experience as I would develop locally on the host.
One thing not addressed in that earlier article is debugging. Using USB debug probes like a SEGGER J-Link or NXP MCU-Link is a challenge inside a container. This applies to any other debug probe as well.
The solution is to transform an USB based debug probe into one with a network connection:
Embedded System have a lifetime of 10 or 15 years. During that time the software and tools has to be maintained. This can be very challenging. Who knows if that compiler or tool used is still available in 10 years from now? Additionally installing and configuring the tool chain and environment for a new team member is difficult. Even worse: using a different host operating system for the cross development can produce different results or introduce issues.
VS Code running with DevContainer
One solution for all these problems is to use Docker images and containers. I can pack all the necessary tools and software into a virtual environment and container. But developing inside a container comes with many challenges. In this article I’ll show how Visual Studio Code or VS Code makes working with containers very easy. In this article I show how easy it is to use modern development tools and methodologies for embedded development.