The latest release of the NXP LinkServer supports ARM 64bit (Debian) besides Windows, Linux and MacOS. With this, I can now develop on an NXP i.MX board. Plus, this enables an inexpensive way for automated on-target tests and CI/CD.

The latest release of the NXP LinkServer supports ARM 64bit (Debian) besides Windows, Linux and MacOS. With this, I can now develop on an NXP i.MX board. Plus, this enables an inexpensive way for automated on-target tests and CI/CD.
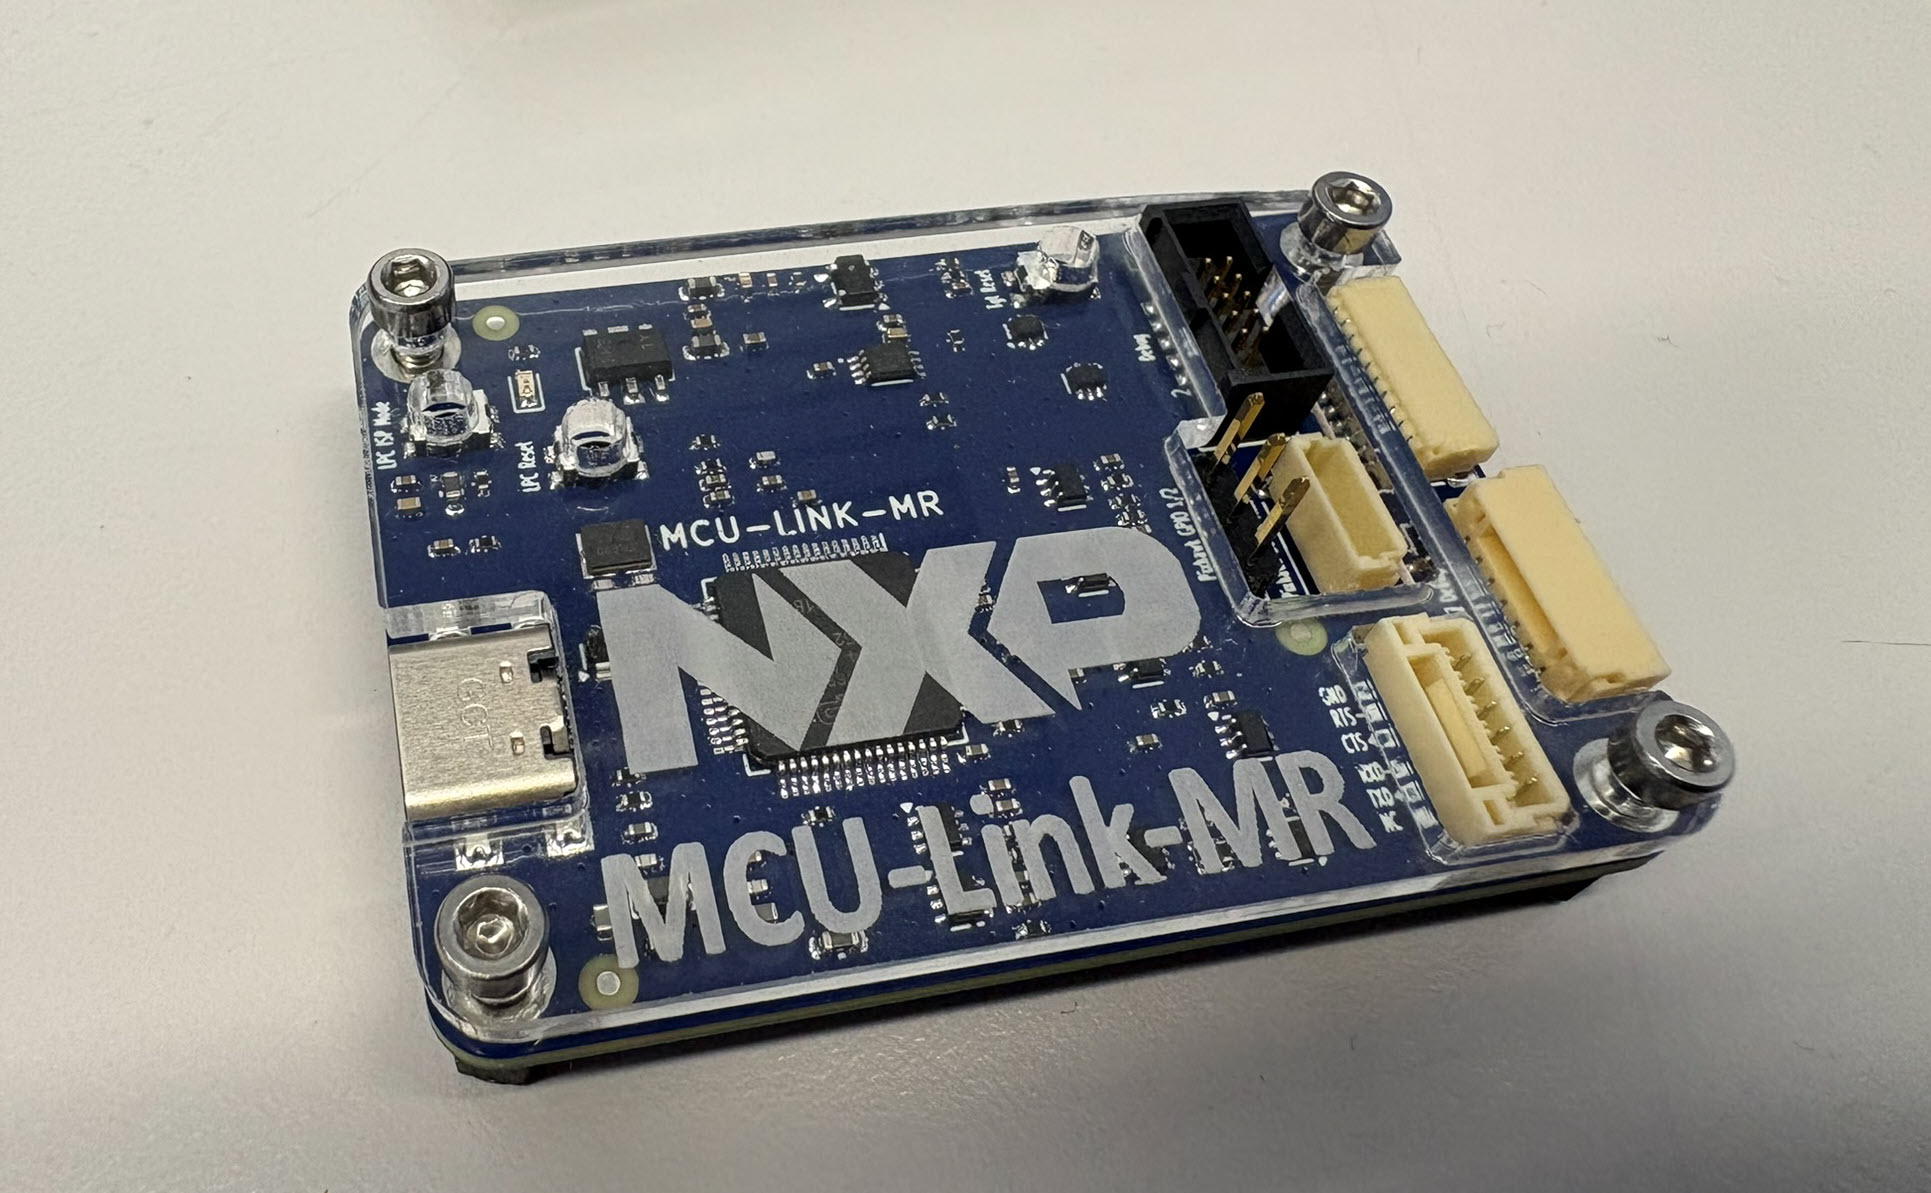
The new v0.5 MCU-Link-MR PCB (see MCU-Link-MR v0.5: Enhanced Debug Probe for ARM Cortex-M) comes with an extra pin header for logic analyzer signals. Because of this I have updated the enclosure for it:
The 3D Printed Rugged Enclosure for NXP MCU-Link Debug Probe has been very useful. I wanted to design something similar for the ‘MCU-Link Pro‘ version of that debug probe. There there is already a laser-cut enclosure for the probe itself. I used the same stack-able rugged box for the debug probe plus all the cables.
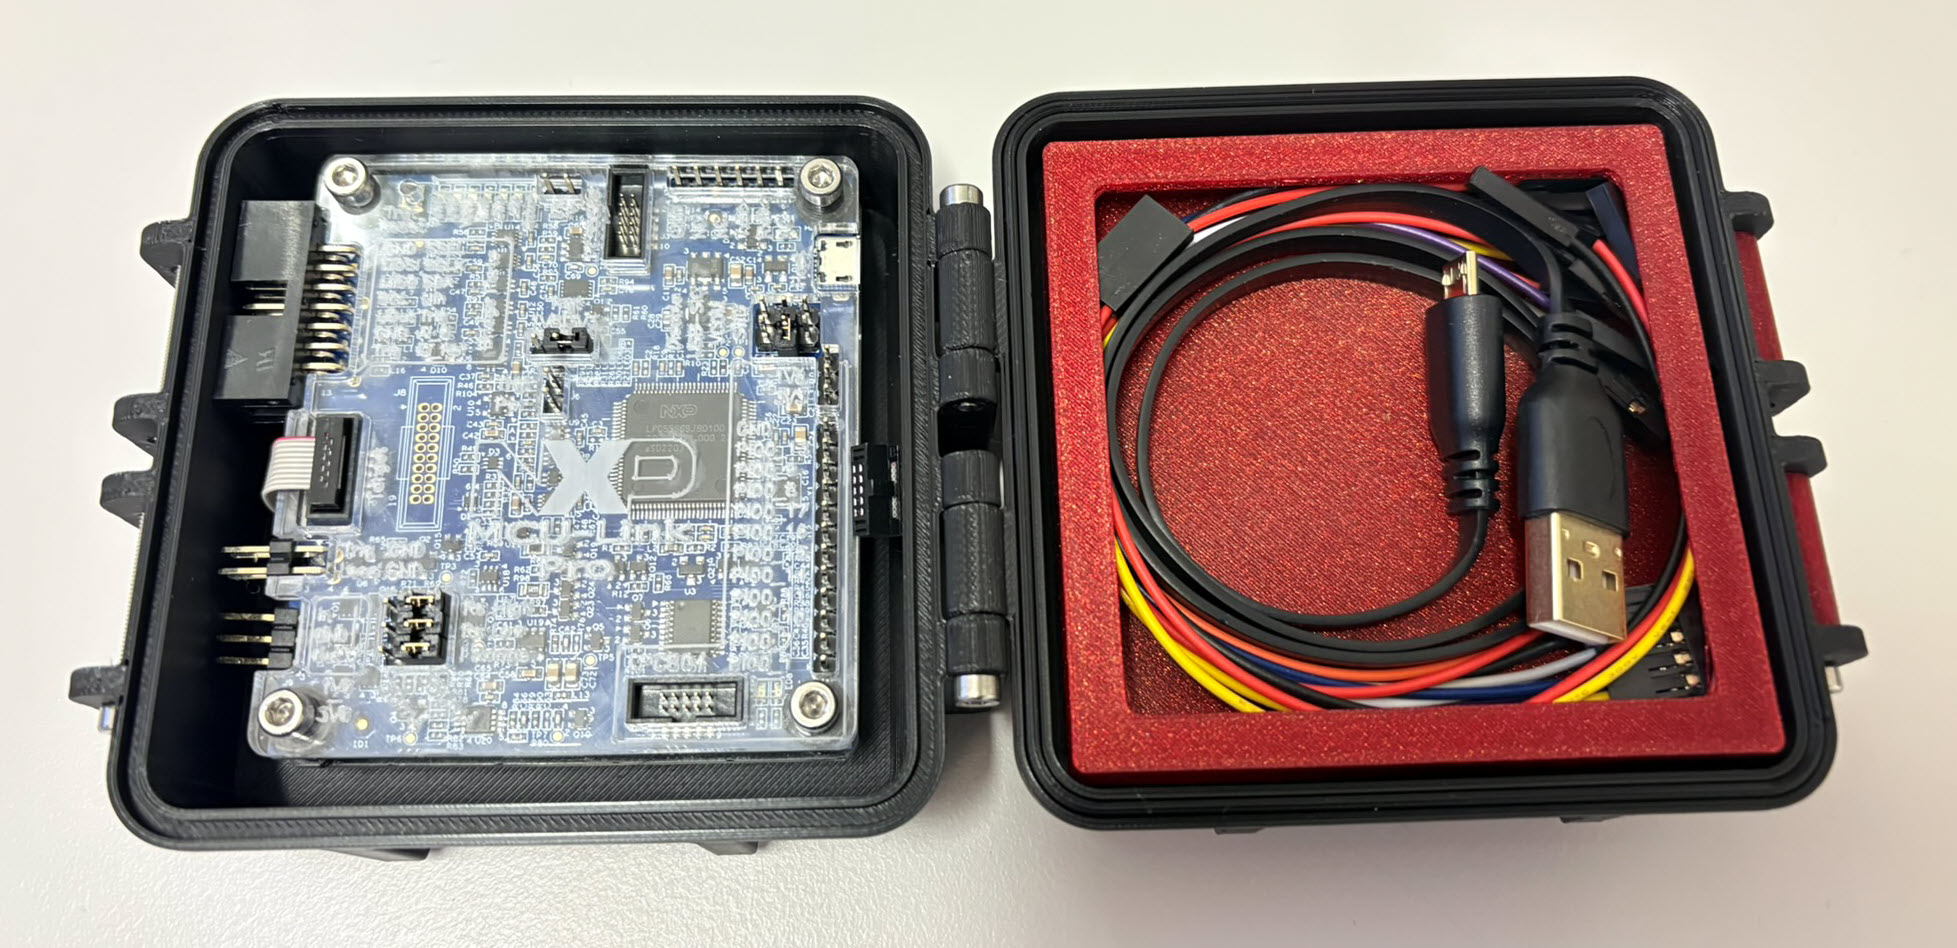
I’m using the NXP MCU-Link CMSIS-DAP debug probe in many of my projects. The debub probe from NXP does not come with an enclosure. I’m traveling to work by train, so I designed a new rugged box and enclosure. The box is small and I can keep all parts inside it.

Today’s projects and systems get more and more complex. Many systems include multiple MCUs, connected with a field bus or network, for example CAN. For example there can be up to 70 CAN nodes in modern cars. Such larger and connected systems are a challenge for debugging.
Traditional hardware debugging requires a hardware debug probe, connected with a dedicated SWD/JTAG debug cable to the target device. This needs dedicated pins on the target device plus physical access to the device itself. In many cases, this is not possible in the final product. The hardware debug probes, cables, pins and high speed signals are costly. And worse they can introduce new problems and are prone to interference.
If there is a field bus like CAN connecting all the MCUs, why not use it for hardware debugging? Hardware debugging meaning programming the FLASH memory, halt the MCU, inspect the memory and registers, and step through the code?
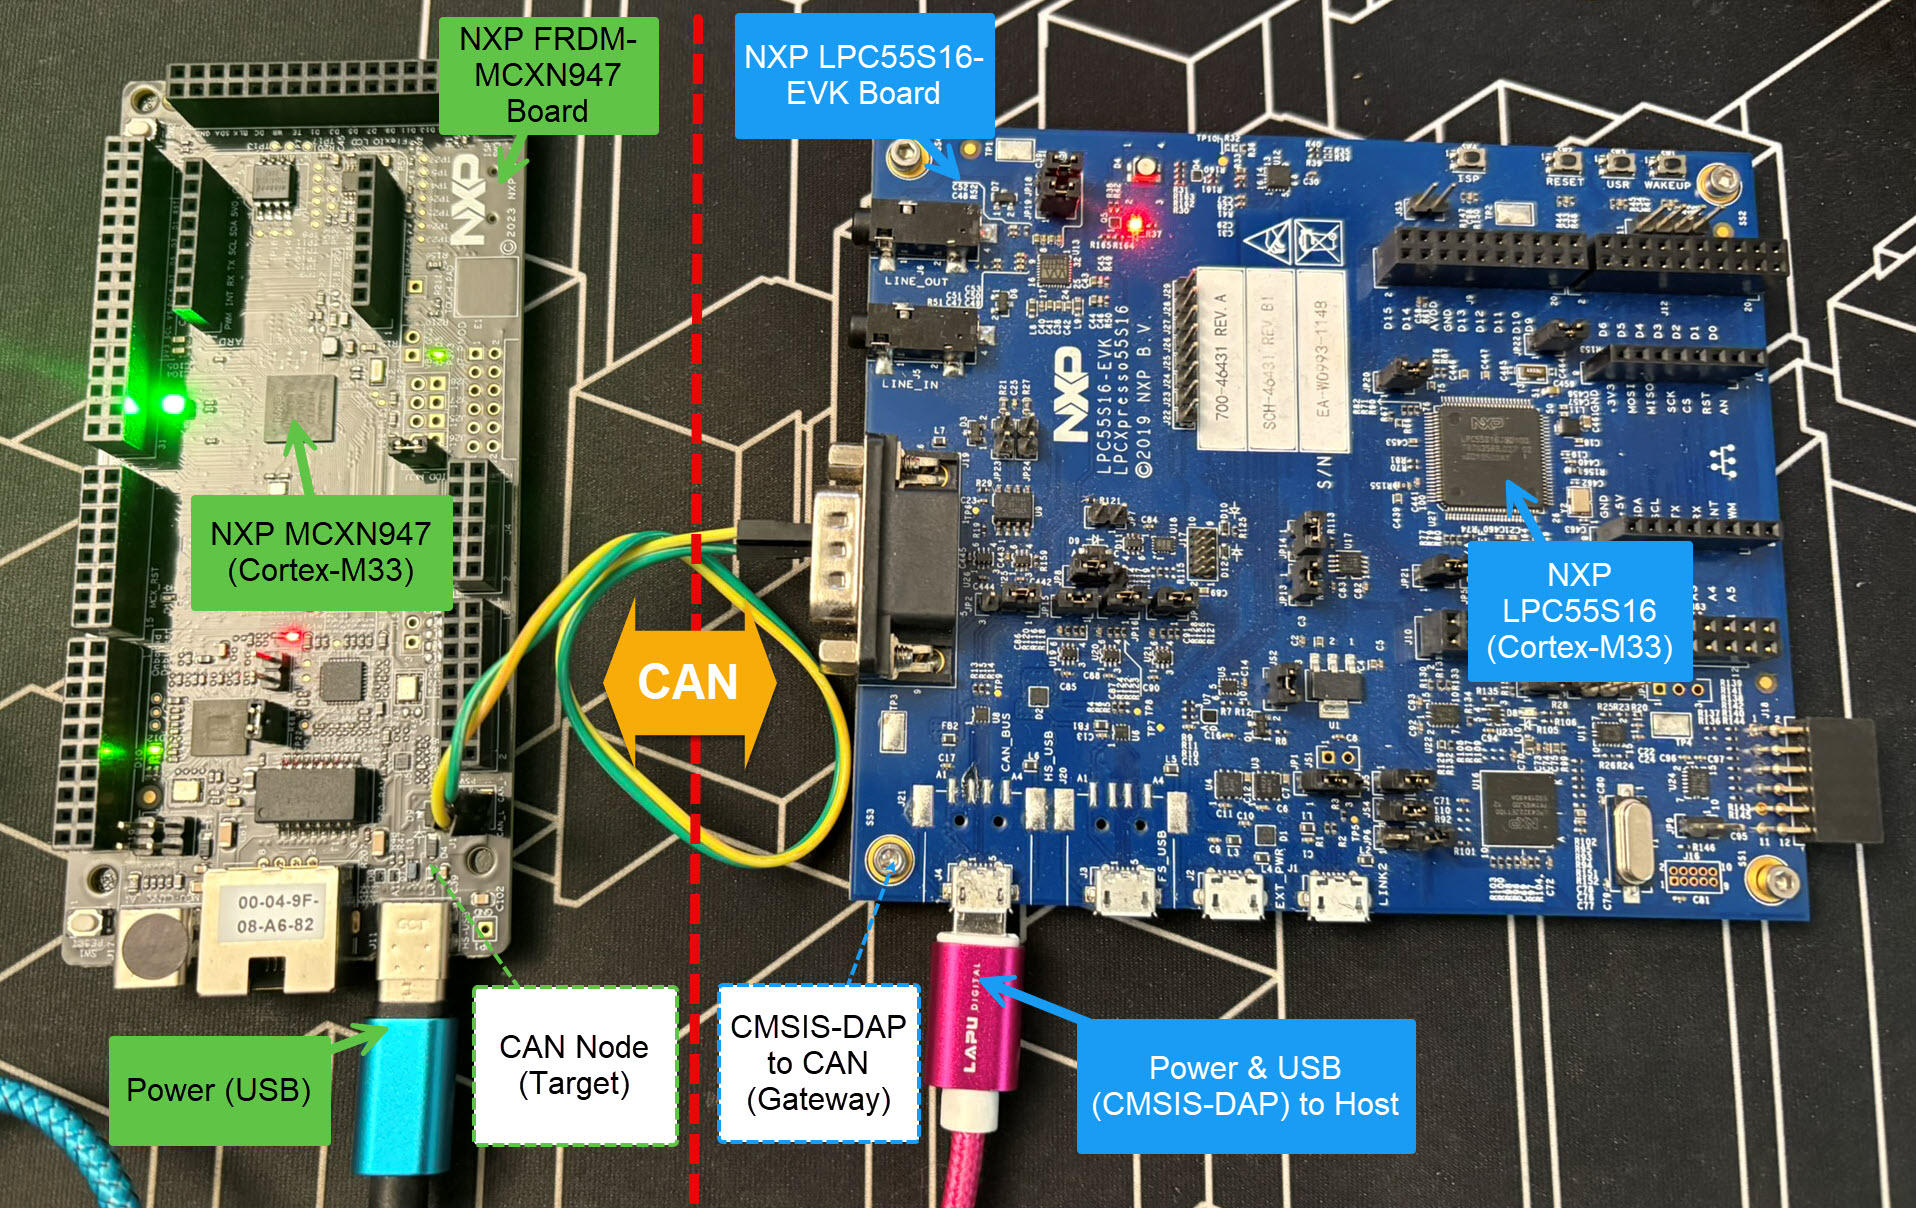
Yes, we can! With the help of a rather unknown hardware feature on ARM Cortex-M devices. We can use the ARM DebugMonitor Interrupt to control and debug the target system. As we would use a JTAG/SWD connection. Instead, we use the CAN bus :-).
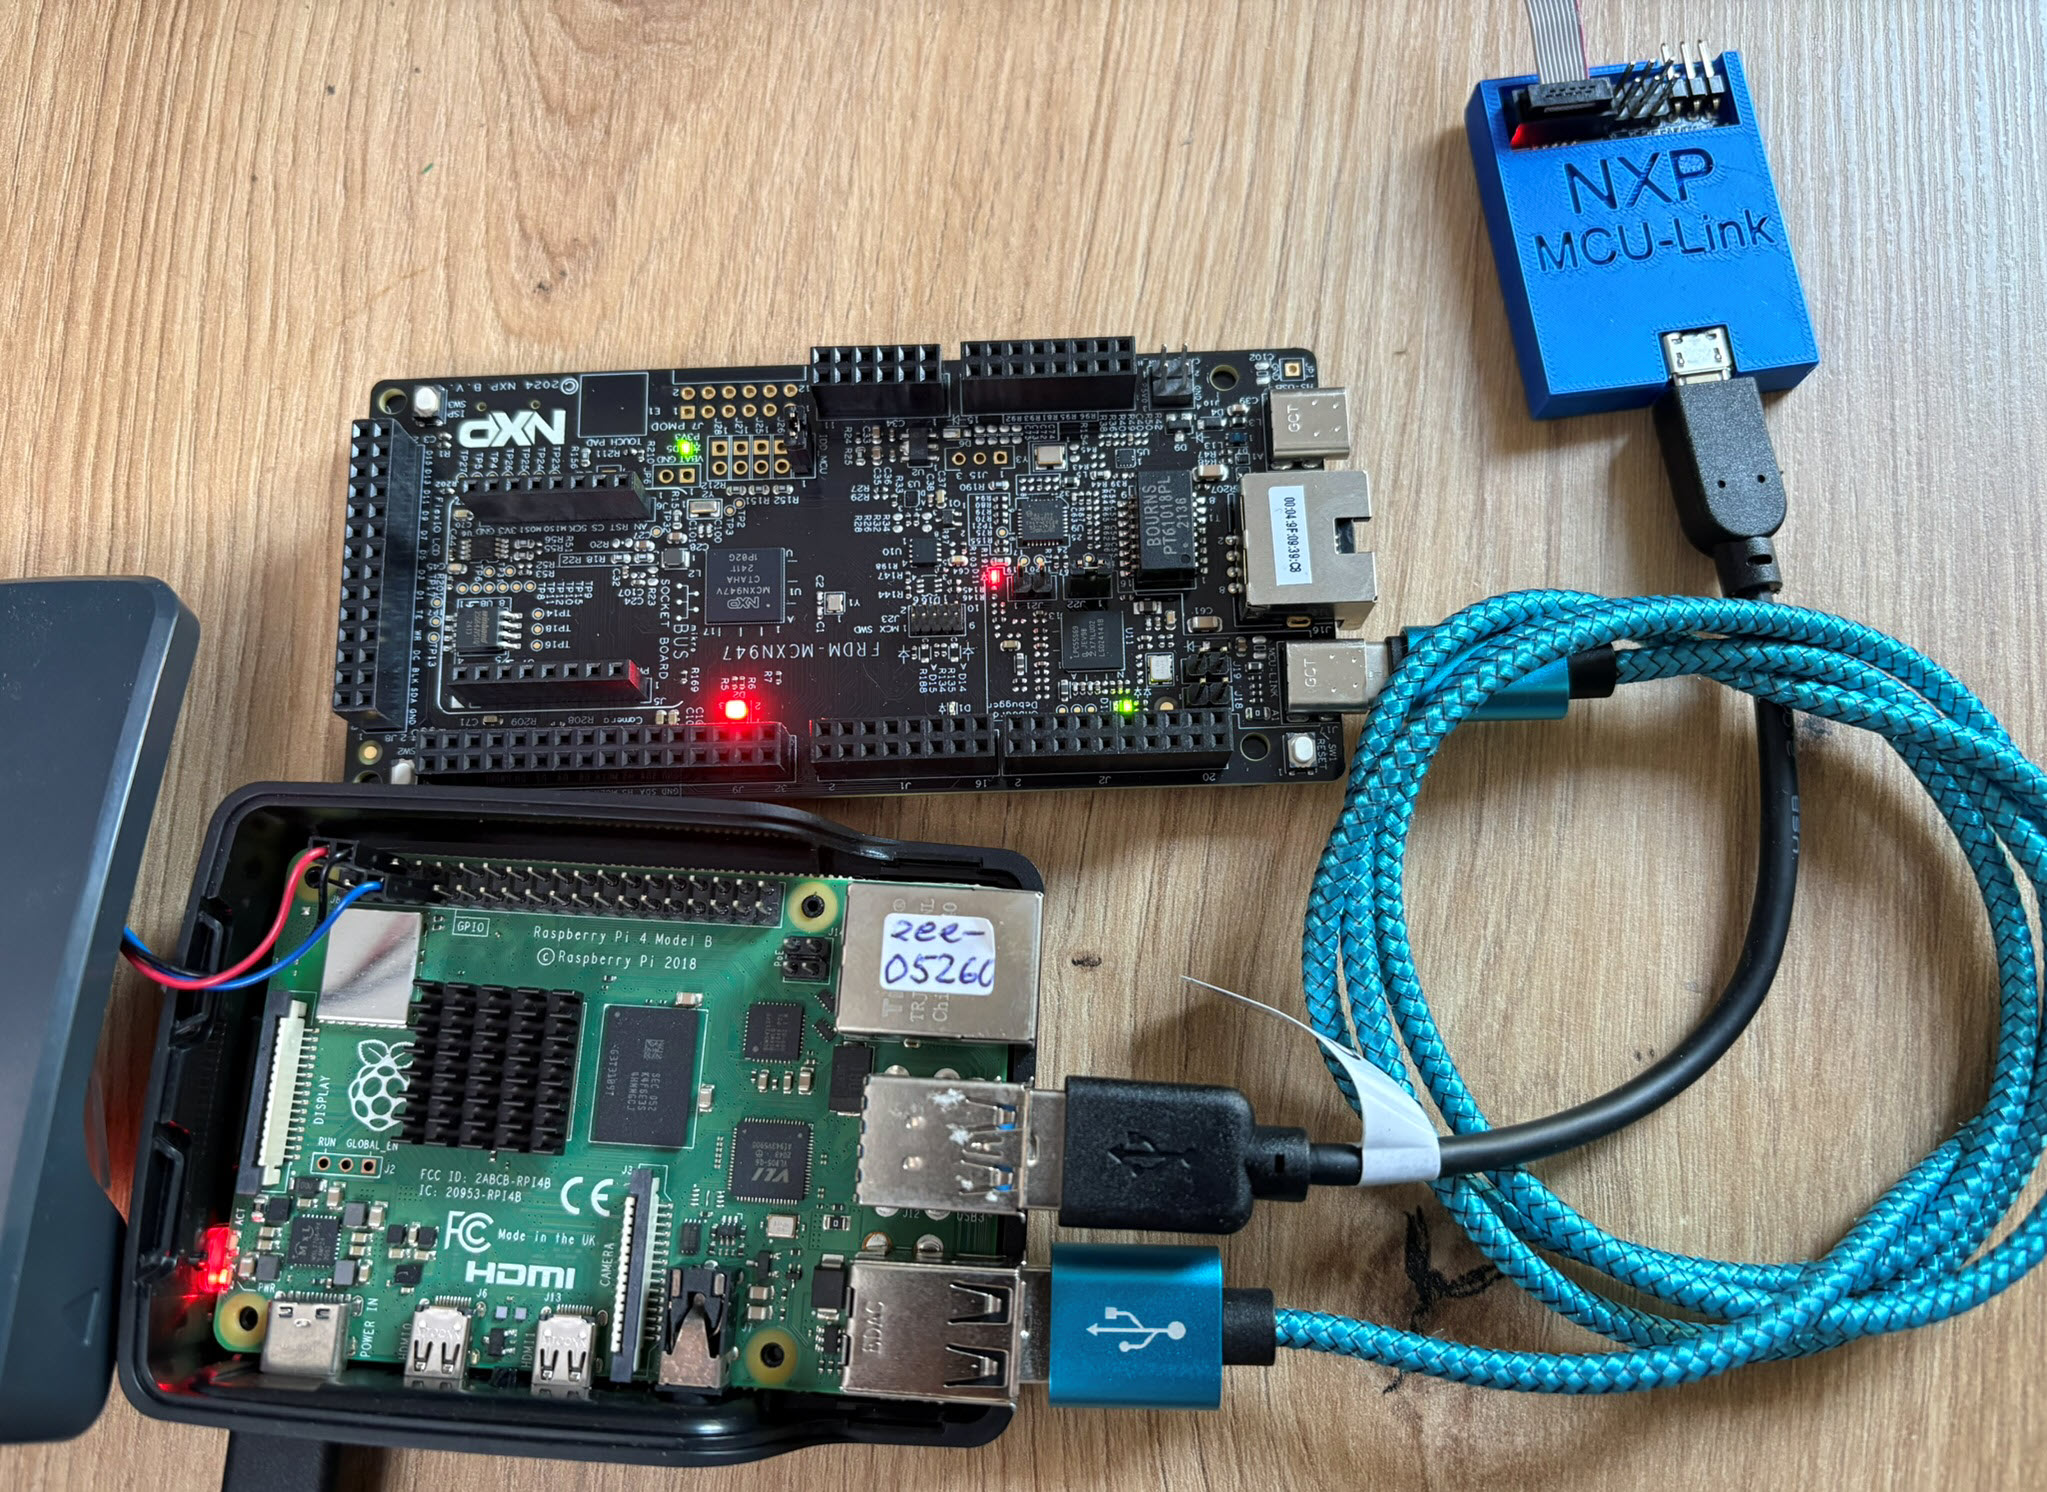
Continue readingIn Using Raspberry Pi and MCU-Link for Remote Embedded Debugging I created a remote server for debugging. I did order the NXP FRDM-IMX93 a few weeks ago, and did not had a chance to use it. So why not doing the same?
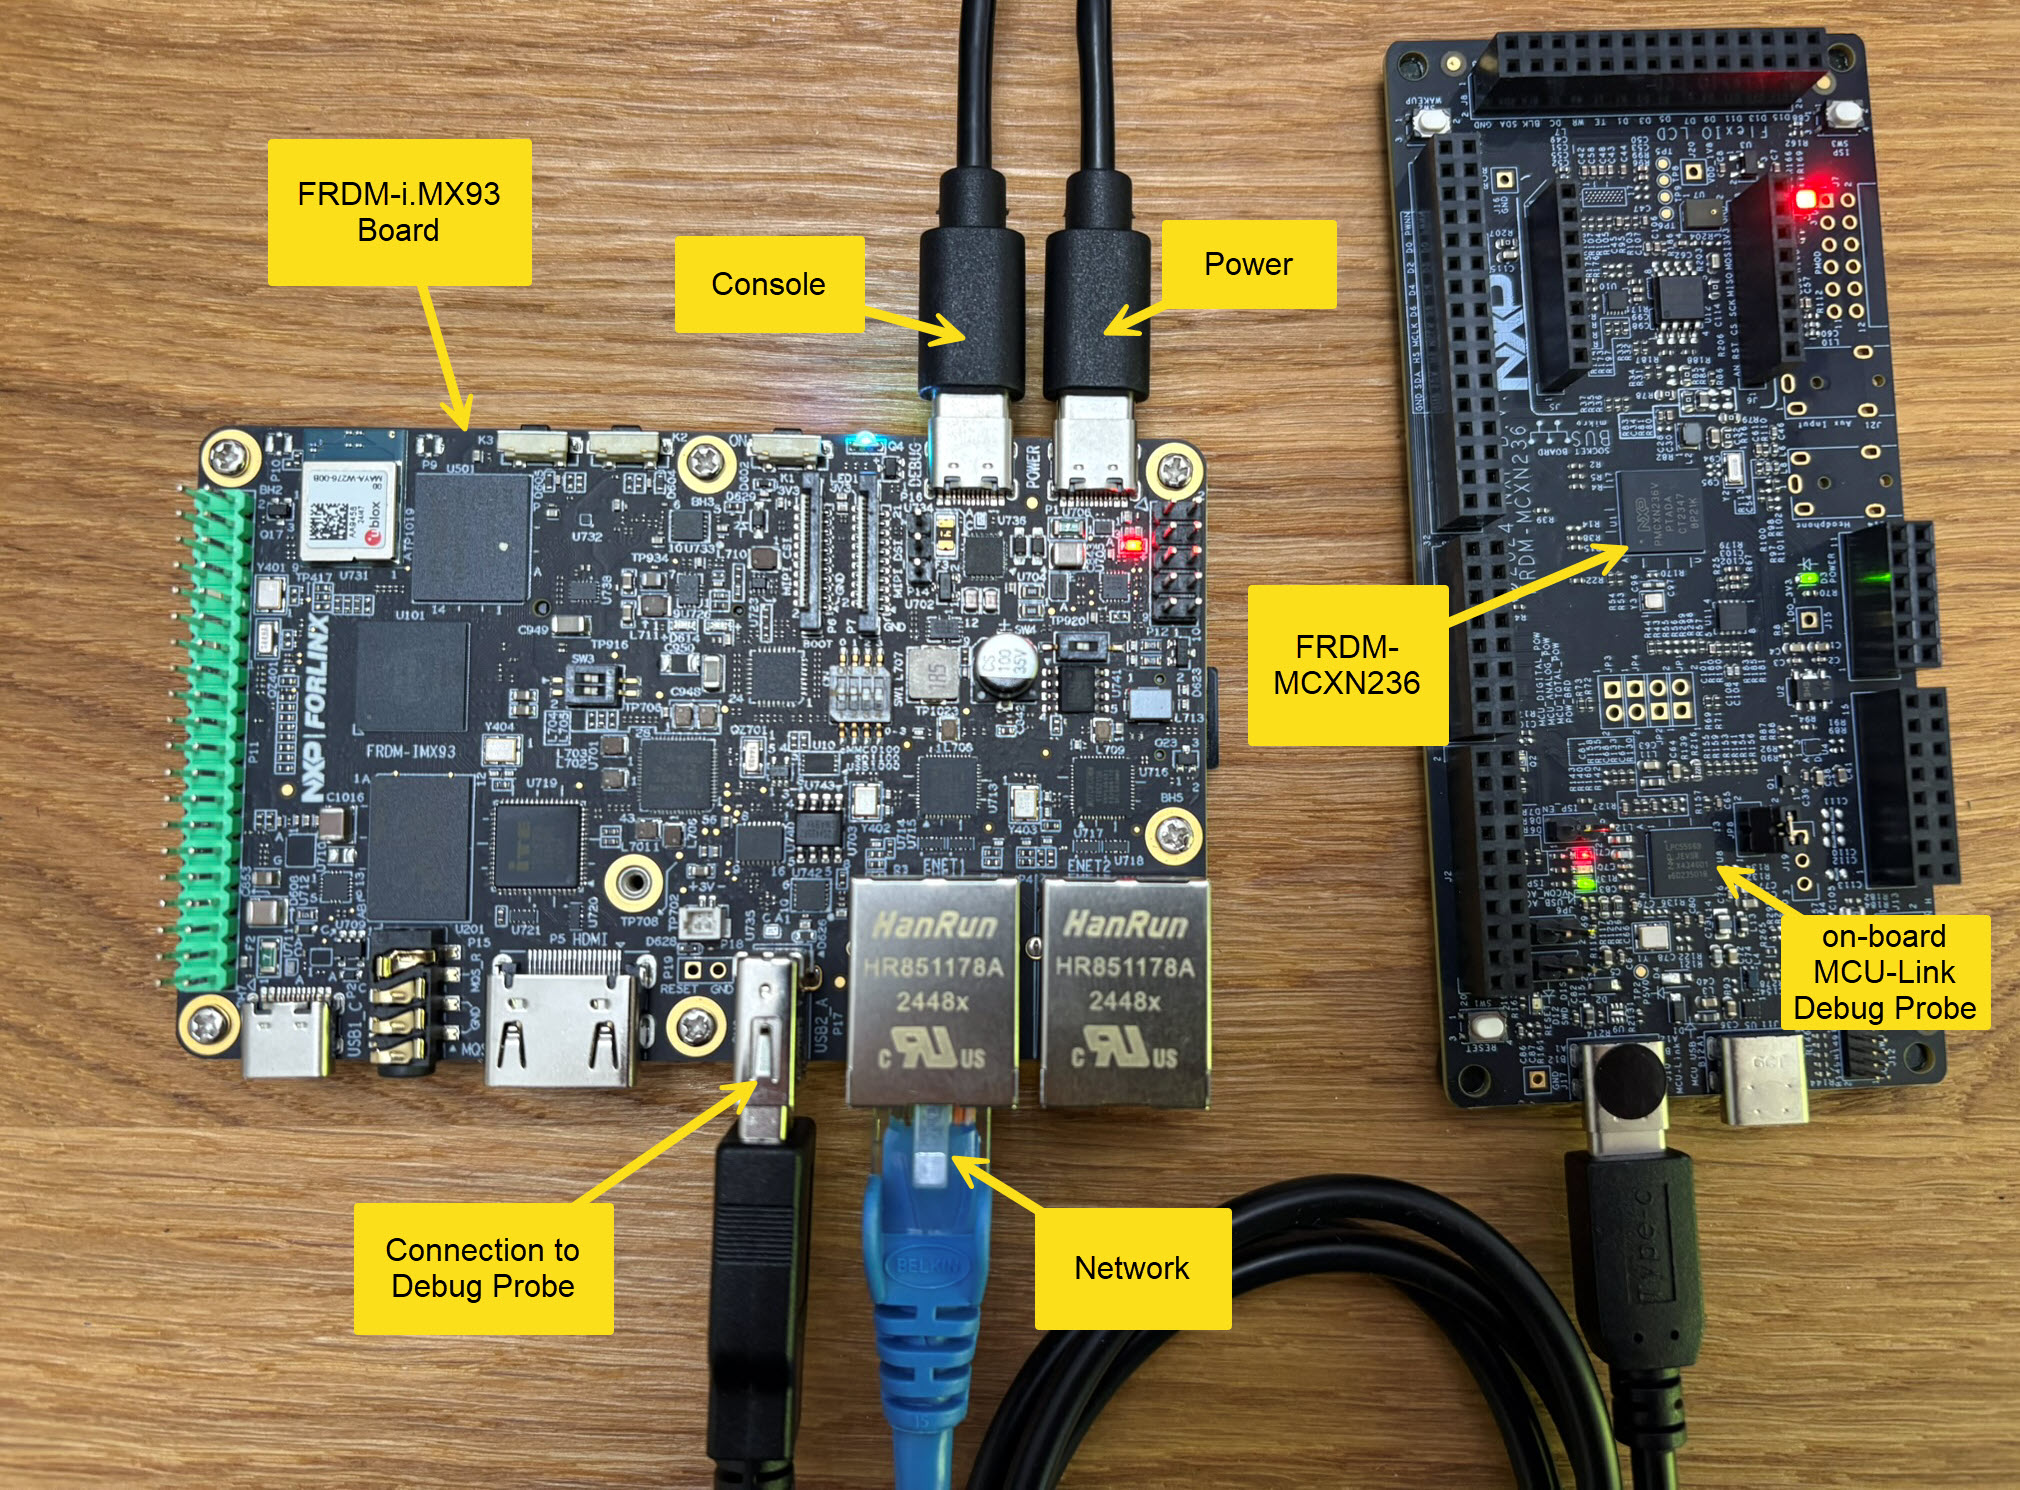
Here is how it can be uses as remote debug server,
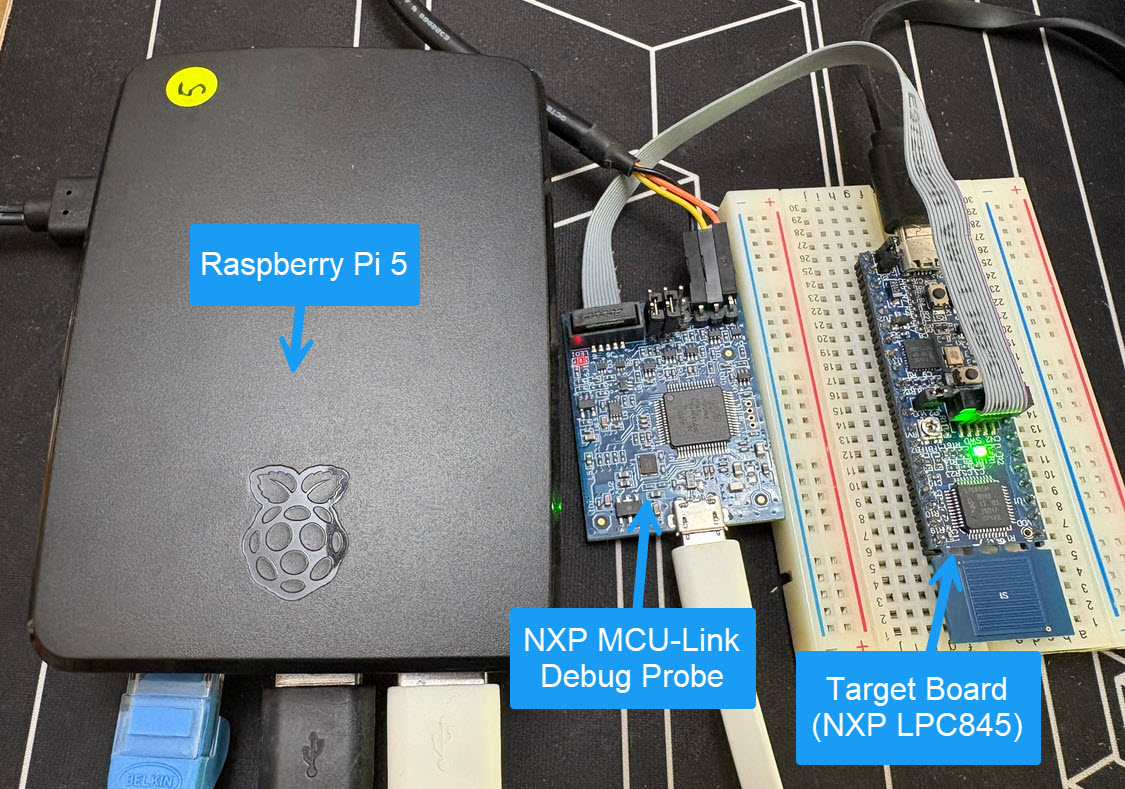
Continue readingRemote debugging an embedded target is very useful: I don’t need a direct debug probe or USB cable connection. Instead, I’m using a network connection (wired or even wireless) over TCP/IP to talk to the debug probe and target. That way I can place the debug probe and target system away from my desk.
In Debugging ARM Cores with IP based Debug Probes and Eclipse I have used IP-based debug probes. This is a logical path, but expensive.
In Remote Debugging with USB based JTAG/SWD Debug Probes I showed how normal USB based debug probes can be used. This approach uses a remote host machine (e.g. desktop machine or notebook). This approach is still expensive, not scalable and the host machine needs a lot of space too.
So what if I use a Raspberry Pi instead? The RPi is small, inexpensive and ideal for such a task. Additionally, I can easily use it to build a test or debug farm. In this article, I show the use of the Raspberry Pi for remote debugging. A sub $20 or embedded target debug probe can be employed.
The MCU-Link-MR from NXP is a CMSIS-DAP debug probe. It includes dedicated connection headers found on mobile robotic systems. These systems include the Pixhawk/PX4 drone and robotics hardware.

This is the second part describing how to use DevContainer for embedded applications with VS Code.
In Optimizing Embedded Development with VS Code and DevContainer I use VS Code with a docker ‘development’ container. The container is created with a recipe to install the development tools and SDK. With VS Code and DevContainer I have the same developer experience as I would develop locally on the host.
One thing not addressed in that earlier article is debugging. Using USB debug probes like a SEGGER J-Link or NXP MCU-Link is a challenge inside a container. This applies to any other debug probe as well.
The solution is to transform an USB based debug probe into one with a network connection:

In this article, I show how to do this.
Continue readingNXP has released a new LinkServer software. It includes an interesting feature. The LinkServer test runner has been extended with a Semihosting console. This is not only very useful for on-target testing. With the Semihosting console, I have a bidirectional communication channel with the target. And I do not need any hardware pins or to run a debug session. All what I need is the CMSIS-DAP connection with the NXP LinkServer runner to have a command line shell: