Git Submodules allow me to keep a git repository as a sub-directory in another git repository. This let me clone another repository into my project and keep sources in and libraries/SDKs in sync.
This can be a challenge if using CI/CD runners. They have to clone the repositories in a recursive way. It gets more complex if the sub-modules are not public. Because the CI/CD runner does not have access rights to the non-public repositories.
GitLab CI/CD Pipeline with successful private submodule usage
In this article I explain how I’m using git sub-modules in my CI/CD GitLab pipeline, both for public and private repositories
The Rust programming language is making its way into different areas: Rust gets added to the Linux Kernel. I see an increasing interest for using Rust in embedded projects. And Rust is used for embedded tools. I noticed this with the latest LinkServer v25.09 release: there is a new tool included in the package, rblhost.
rblhost on crates.io
The release note just mentioned:
- Switched to using rapid blhost (rblhost) utility.
This triggered my interest, and actually that utility is implemented in Rust :-).
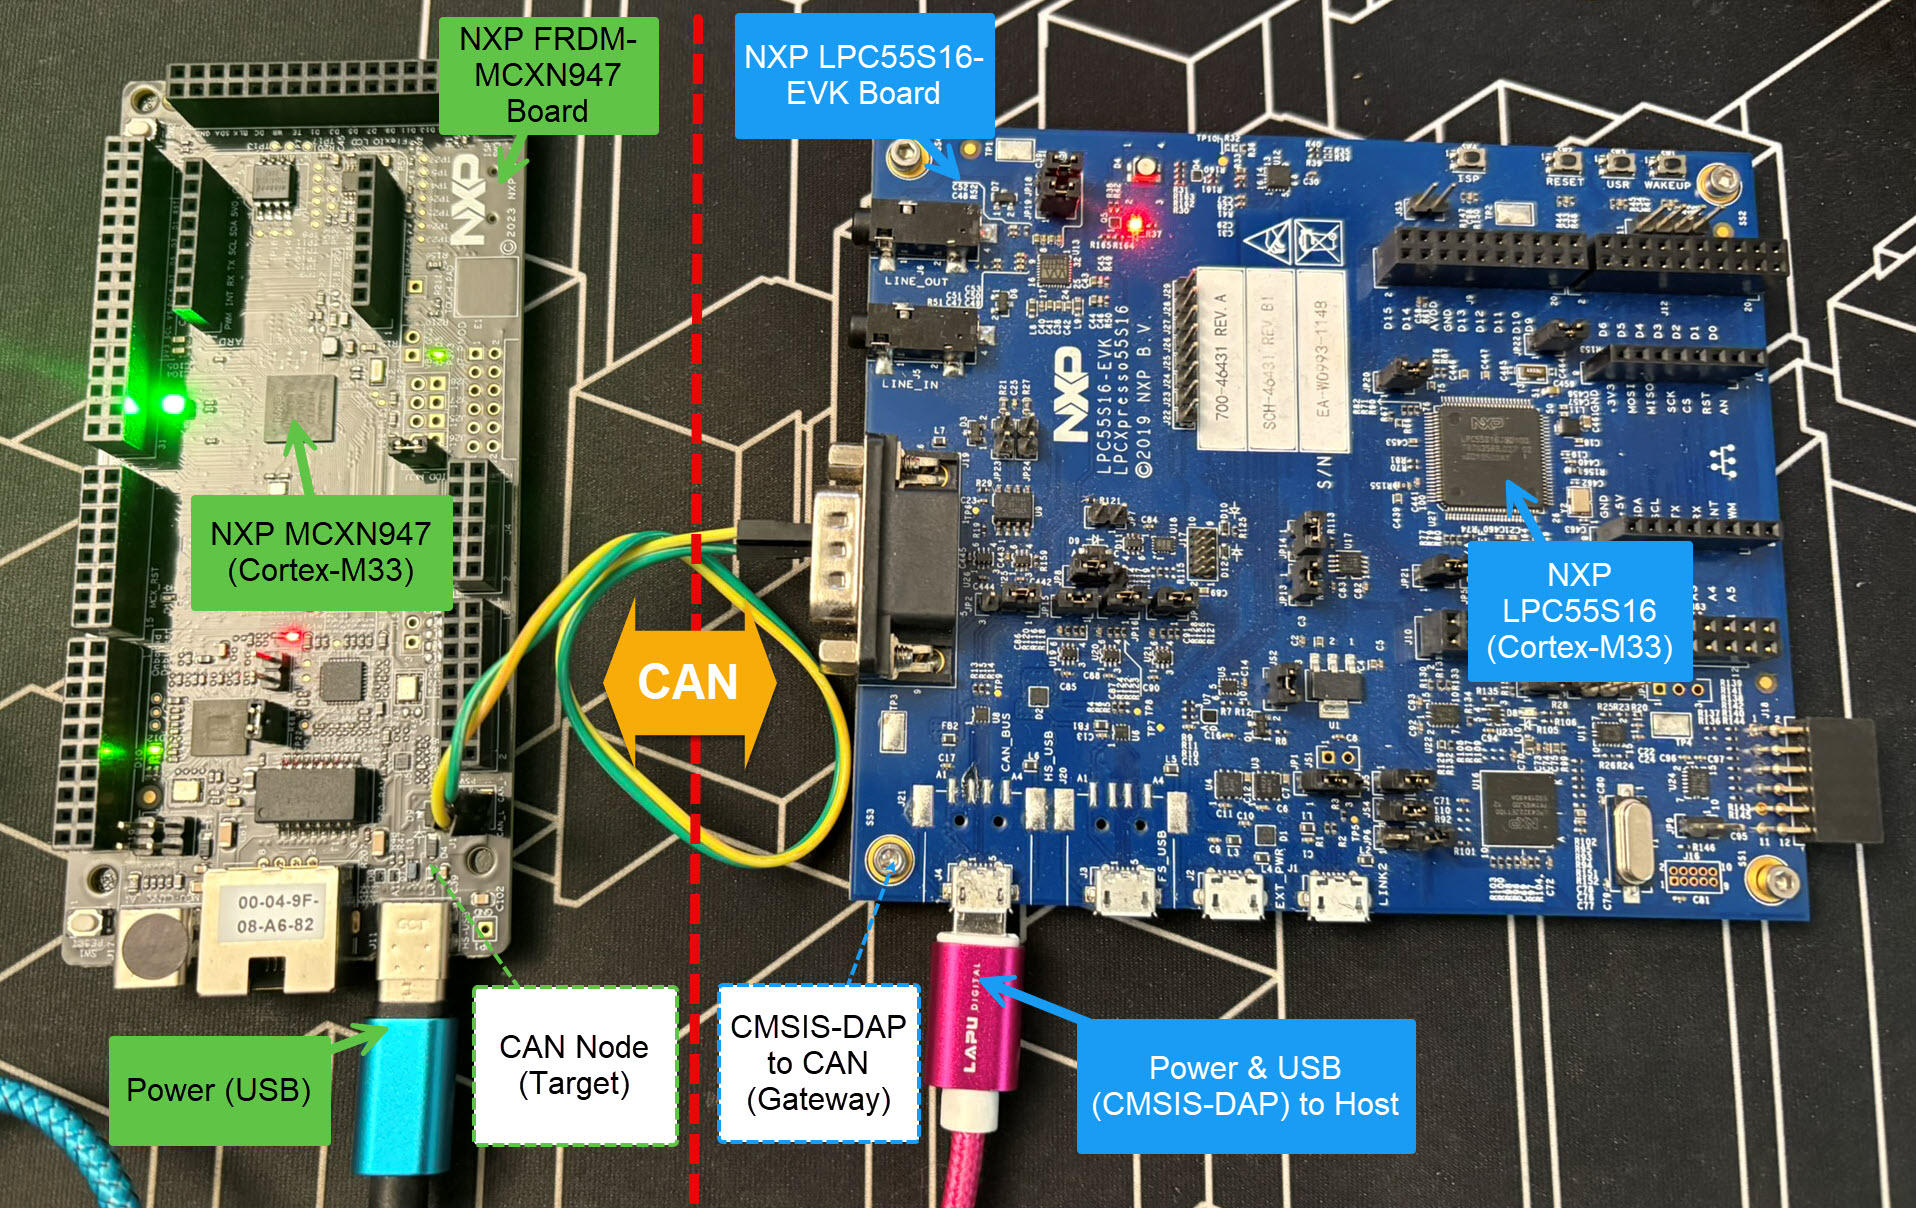
Today’s projects and systems get more and more complex. Many systems include multiple MCUs, connected with a field bus or network, for example CAN. For example there can be up to 70 CAN nodes in modern cars. Such larger and connected systems are a challenge for debugging.
Traditional hardware debugging requires a hardware debug probe, connected with a dedicated SWD/JTAG debug cable to the target device. This needs dedicated pins on the target device plus physical access to the device itself. In many cases, this is not possible in the final product. The hardware debug probes, cables, pins and high speed signals are costly. And worse they can introduce new problems and are prone to interference.
If there is a field bus like CAN connecting all the MCUs, why not use it for hardware debugging? Hardware debugging meaning programming the FLASH memory, halt the MCU, inspect the memory and registers, and step through the code?
Cortex-M Hardware Debugging over CAN
Yes, we can! With the help of a rather unknown hardware feature on ARM Cortex-M devices. We can use the ARM DebugMonitor Interrupt to control and debug the target system. As we would use a JTAG/SWD connection. Instead, we use the CAN bus :-).
SonarQube from Sonar is a free static analysis tool for VS Code. It is able to analyze the source code and find issues. SonarQube does a similar job as other static analysis tools like CppCheck for VS Code.
The NXP SDK is git based which is great. If I create a project with VS code, it references the SDK cloned locally.
Standard NXP SDK Project in VS Code
A standalone project structure is needed if you want to easily share a project with your team. It’s also necessary for sharing inside a classroom environment. This article shows how to use an NXP SDK project in standalone mode.
Embedded System have a lifetime of 10 or 15 years. During that time the software and tools has to be maintained. This can be very challenging. Who knows if that compiler or tool used is still available in 10 years from now? Additionally installing and configuring the tool chain and environment for a new team member is difficult. Even worse: using a different host operating system for the cross development can produce different results or introduce issues.
VS Code running with DevContainer
One solution for all these problems is to use Docker images and containers. I can pack all the necessary tools and software into a virtual environment and container. But developing inside a container comes with many challenges. In this article I’ll show how Visual Studio Code or VS Code makes working with containers very easy. In this article I show how easy it is to use modern development tools and methodologies for embedded development.
I’m making progress on my larger split-flap project (see Update on the Split-Flap Project for 2025). So far I have 32 operational for the larger 64 flap installation. In parallel, I worked on a smaller 4 flaps unit used as a clock.
If working with different tool chains, SDKs, and vendors, then one must use different environments.
With VS Code, this can end up in counter-intuitive situation. When I start a new Visual Studio Code instance, it will open a new window. But if there is already an instance running, it actually will re-using that environment. This can cause lots of subtle problems, including failed builds.
VS Code re-using instance environment
So how to start a new Visual Studio Code Window, with a new instance?