I recently discovered a nice feature in Eclipse CDT: the ability to show the return value of a function:

Return Value shown as Variable
I recently discovered a nice feature in Eclipse CDT: the ability to show the return value of a function:
Return Value shown as Variable
By default, the GNU compiler (gcc) optimizes each compilation unit (source file) separately. This is effective, but misses the opportunity to optimize across compilation units. Here is where the Link Time Optimization (LTO, option -flto) can help out: with a global view it can optimize one step further.
The other positive side effect is that the linker can flag possible issues like the one below which are not visible to the compiler alone:
type of '__SP_INIT' does not match original declaration [enabled by default]

Warning by LTO
Decisions, decisions! Such long weekends like Pentecost are a real challenge for a family with engineers:
Well, my family vote was kind of clear: they have chosen that second option. Not to mention that hidden technology piece in it, but that was part of the deal ;-).
And I’m sorry: this article is not about BBQ (for this see “Smoking BBQ Baby Back Ribs – Swiss Style“), it is about technology: I’m using the NXP MCUXpresso IDE and tools for many of my projects (see “Eclipse MCUXpresso IDE 10.1 with integrated MCUXpresso Configuration Tools“). Right before the this extended weekend, NXP has released the new v10.2.0 version, so here is where that technology exploration piece comes into play. Checking the release notes, this version number change includes so many cool stuff I decided to have a look and to check it out. Of course always having an electronic eye on the baby back ribs!

MCUXpresso IDE v10.2.0
Using IP (Ethernet) based debug probes is a very handy thing: I don’t have to be directly connected to the debug probe (e.g. with the USB cable). This article explains how to use an IP-based Segger or P&E probe with the Eclipse based MCUXpresso IDE.

LAN Based Debugging
Windows 8 and 10 have added a ‘feature’ to scan and index devices attached to the host machine. This means that bootloaders or MSD (Mass Storage Device) programming implementations on evaluation boards developed in the Windows 7 age might not be prepared for that. Up to the point that it can impact the bootloader as outlined in “Bricking and Recovering OpenSDA Boards in Windows 8 and 10“. So far one of the easiest way to get out that situation was to use a Windows 7 machine. But if you only have a Windows 10 machine available, this article describes the needed steps to update the bootloader with Windows 10 host machines.

OpenSDA LED
In “Flash-Resident USB-HID Bootloader with the NXP Kinetis K22 Microcontroller” I presented how I’m using the tinyK22 (or FRDM-K22F) with a flash resident USB HID bootloader. To make sure that the loaded application is not corrupted somehow, it is important to verify it with a Cyclic redundancy Checksum (CRC). The NXP KBOOT Bootloader can verify such a CRC, but how to generate one and how to use it is not really obvious (at least to me), so this article explains how to generate that CRC.

CRC Values for KBOOT
One of the great things with the FreeRTOS operating system is that it comes with free performance analysis: It shows me how much time is spent in each task. Best of all: it shows it in a graphical way inside Eclipse too:

FreeRTOS Runtime Information in Eclipse
To solve the real hard problem of Embedded Systems development, I usually need all the data I can get from the target. The Percepio Tracealizer is such a tool which can stream application and FreeRTOS trace from the target over a Segger J-Link connection using the Segger RTT protocol. I’m using that combination a lot.
Streaming trace data that way does not need a dedicated hardware like ETM Trace. Using RTT is usually not much intrusive and affects the performance of the target in the 1-2% range (of course depending on the amount of data).
But what worried me for several weeks is that after moving to FreeRTOS V10.0.0 and the same time updating the Segger libraries, the target performance was heavily affected:
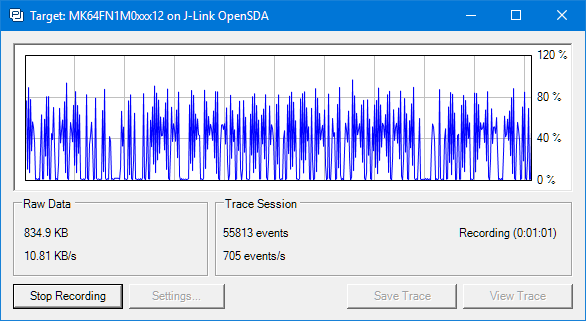
RTT streaming affects target performance?
Right before the start of the new semester, the new tinyK22 boards (see “First tinyK22 Board with NXP K22FN512 ARM Cortex-M4F“) arrived, and they are looking great 🙂
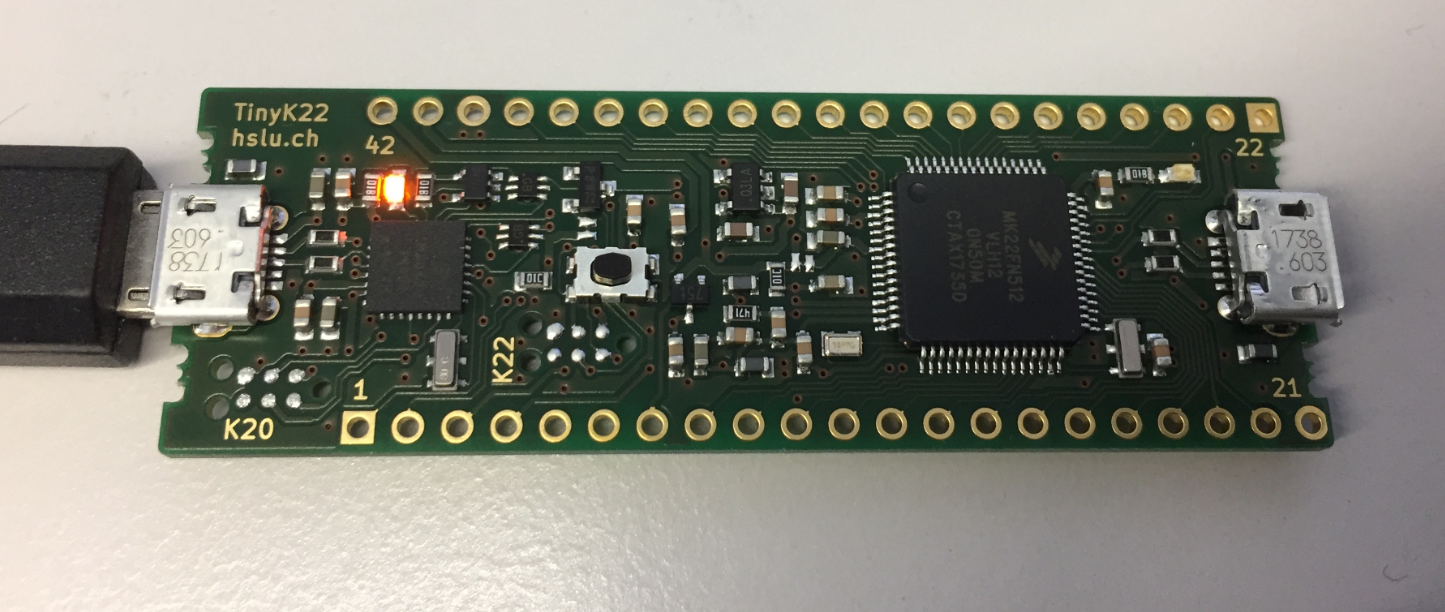
tinyK22 Board
Three years ago I published “Debugging Failure: Check List and Hints” and unfortunately this article is one of the most popular ones: obviously debugging problems are very common. Debugging with GDB works usually fine, but if things are failing, then it can be hard to find the cause for it. Recently I have been asked to check some failures, so here are two more hints about what could go wrong…

Error while launching command: arm-none-eabi-gdb –version
 MCU on Eclipse