Sometimes, all what I have is a ELF/Dwarf binary, and I need to debug it. I don’t want to build it, only debug it. The NXP VS Code extension makes that possible. I simply import the binary and start debugging.

Sometimes, all what I have is a ELF/Dwarf binary, and I need to debug it. I don’t want to build it, only debug it. The NXP VS Code extension makes that possible. I simply import the binary and start debugging.
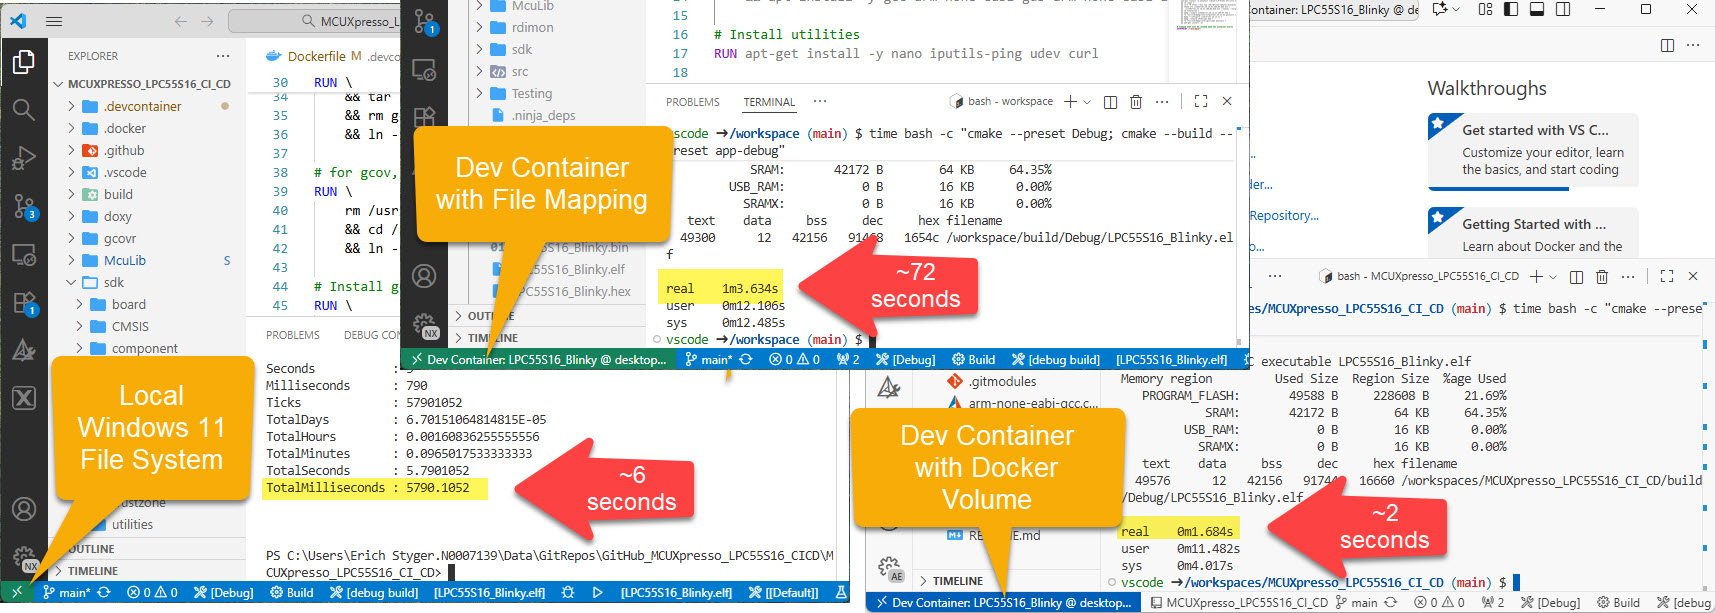
I recently upgraded from Win10 to Win11. Windows 10 was not great for building performance compared to Linux. And I feel that with Windows 11 things got worse too.
Dev Container in VS Code uses docker-based environments. This enables me using a full-featured development environment, with isolated dependencies. This is especially very useful for development in the embedded systems space. There I have to use many different SDKs, toolchains and libraries. Using Dev Containers is super easy. But file I/O operations with building etc/is not that great.
The solution is to use a Docker Volume with VS Code and Dev Container:
Today’s projects and systems get more and more complex. Many systems include multiple MCUs, connected with a field bus or network, for example CAN. For example there can be up to 70 CAN nodes in modern cars. Such larger and connected systems are a challenge for debugging.
Traditional hardware debugging requires a hardware debug probe, connected with a dedicated SWD/JTAG debug cable to the target device. This needs dedicated pins on the target device plus physical access to the device itself. In many cases, this is not possible in the final product. The hardware debug probes, cables, pins and high speed signals are costly. And worse they can introduce new problems and are prone to interference.
If there is a field bus like CAN connecting all the MCUs, why not use it for hardware debugging? Hardware debugging meaning programming the FLASH memory, halt the MCU, inspect the memory and registers, and step through the code?
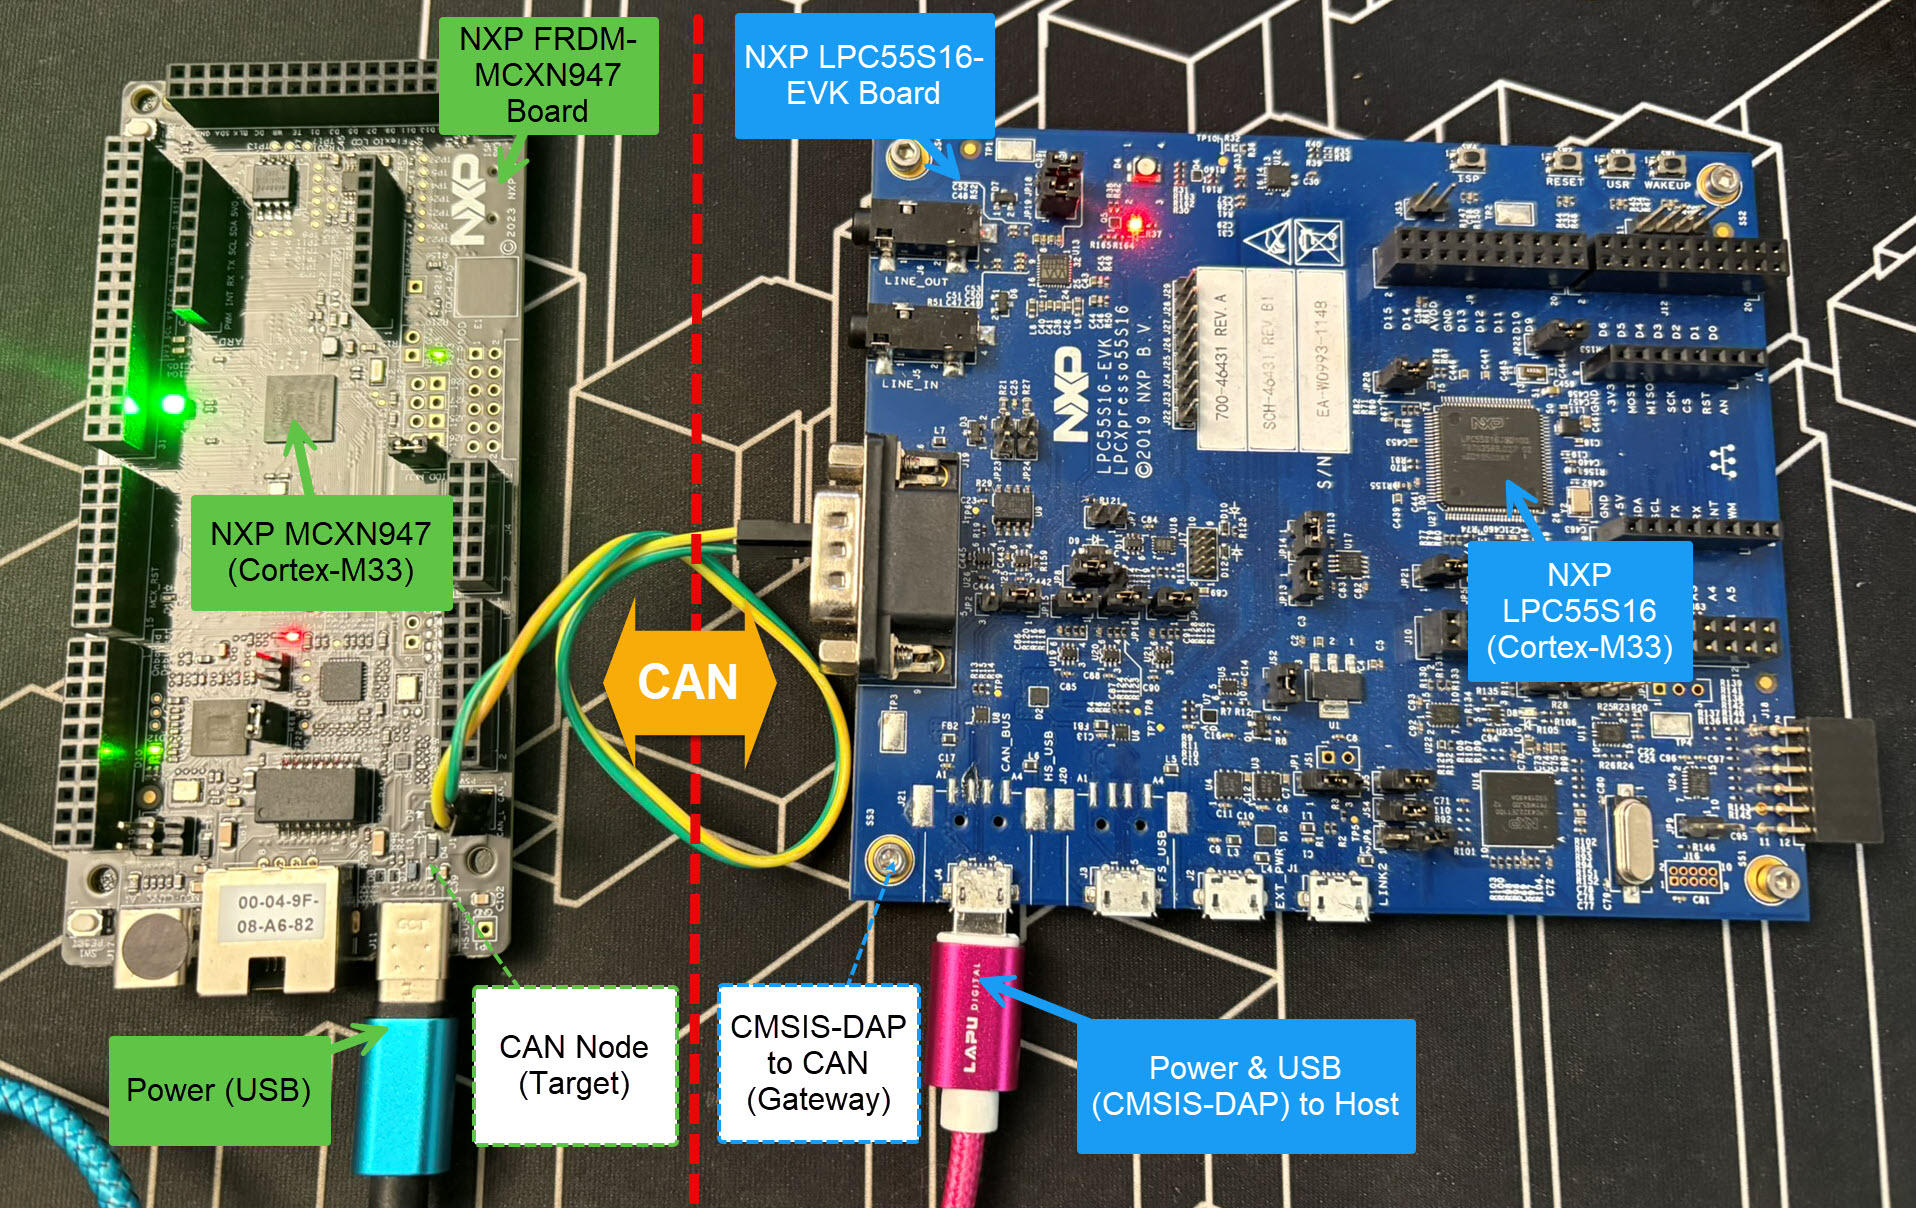
Yes, we can! With the help of a rather unknown hardware feature on ARM Cortex-M devices. We can use the ARM DebugMonitor Interrupt to control and debug the target system. As we would use a JTAG/SWD connection. Instead, we use the CAN bus :-).
Continue readingTest coverage is a very useful metric: it tells how much of your code has been covered by tests. Or the other way: it helps identifying areas of my code which has not been running tests. A new CMake extension in VS Code is available. It works with the new NXP LinkServer test runner to allow running tests on an embedded target. The really cool thing is: it collects and visualizes test data with coverage information in a single step:

The NXP SDK is git based which is great. If I create a project with VS code, it references the SDK cloned locally.

A standalone project structure is needed if you want to easily share a project with your team. It’s also necessary for sharing inside a classroom environment. This article shows how to use an NXP SDK project in standalone mode.
Continue readingNXP has released a new LinkServer software. It includes an interesting feature. The LinkServer test runner has been extended with a Semihosting console. This is not only very useful for on-target testing. With the Semihosting console, I have a bidirectional communication channel with the target. And I do not need any hardware pins or to run a debug session. All what I need is the CMSIS-DAP connection with the NXP LinkServer runner to have a command line shell:
The year 2024 is coming to its end, time for a Year-End-Processor-Expert-Component-Release.

Also, this is now the 10th anniversary of the releases on Sourceforge, starting with https://mcuoneclipse.com/2014/10/21/mcuoneclipse-releases-on-sourceforge/ back in 2014.
Continue readingNXP has released a new version of the LinkServer software. This is a utility for debugging and using scripting for a wide range of devices and debugging probes. It includes support for the MCU-Link, LPC-Link2, on-board and CMSIS-DAP based debug probes with the ‘LinkFlash’:

With the new release, it includes a graphical user interface (GUI) for flash programming. It also includes erasing, verifying, recovery, and saving the memory to a file.
Continue readingThe GNU Coverage (gcov) is a source code analysis tool, and is a standard utility in the GNU gcc suite. It works great in a hosted environment (e.g. Linux or Windows), where you have plenty of resources and a file system. But the gcov tools is relevant and usable for restricted embedded systems too. I have used it for years with the help of debug probes and file I/O semihosting. But semihosting does not come for free, depends on a library with support for constructors and destructors, plus relies on file I/O.
Fortunately, there is a way to use gcov without debugger, semihosting, file I/O and special system initialization: using a freestanding environment:

This article explains how to collect coverage information using a data stream for example over UART or USB-CDC. Key benefits are less code side, no need for a debugger or on-target file system, improved performance, better automation and flexible data collection.
Continue readingA new eclipse-based NXP MCUXpresso IDE v11.10 is available With this new release, it includes an even easier firmware update mechanism for the MCU-Link (LinkServer) debug probes.

