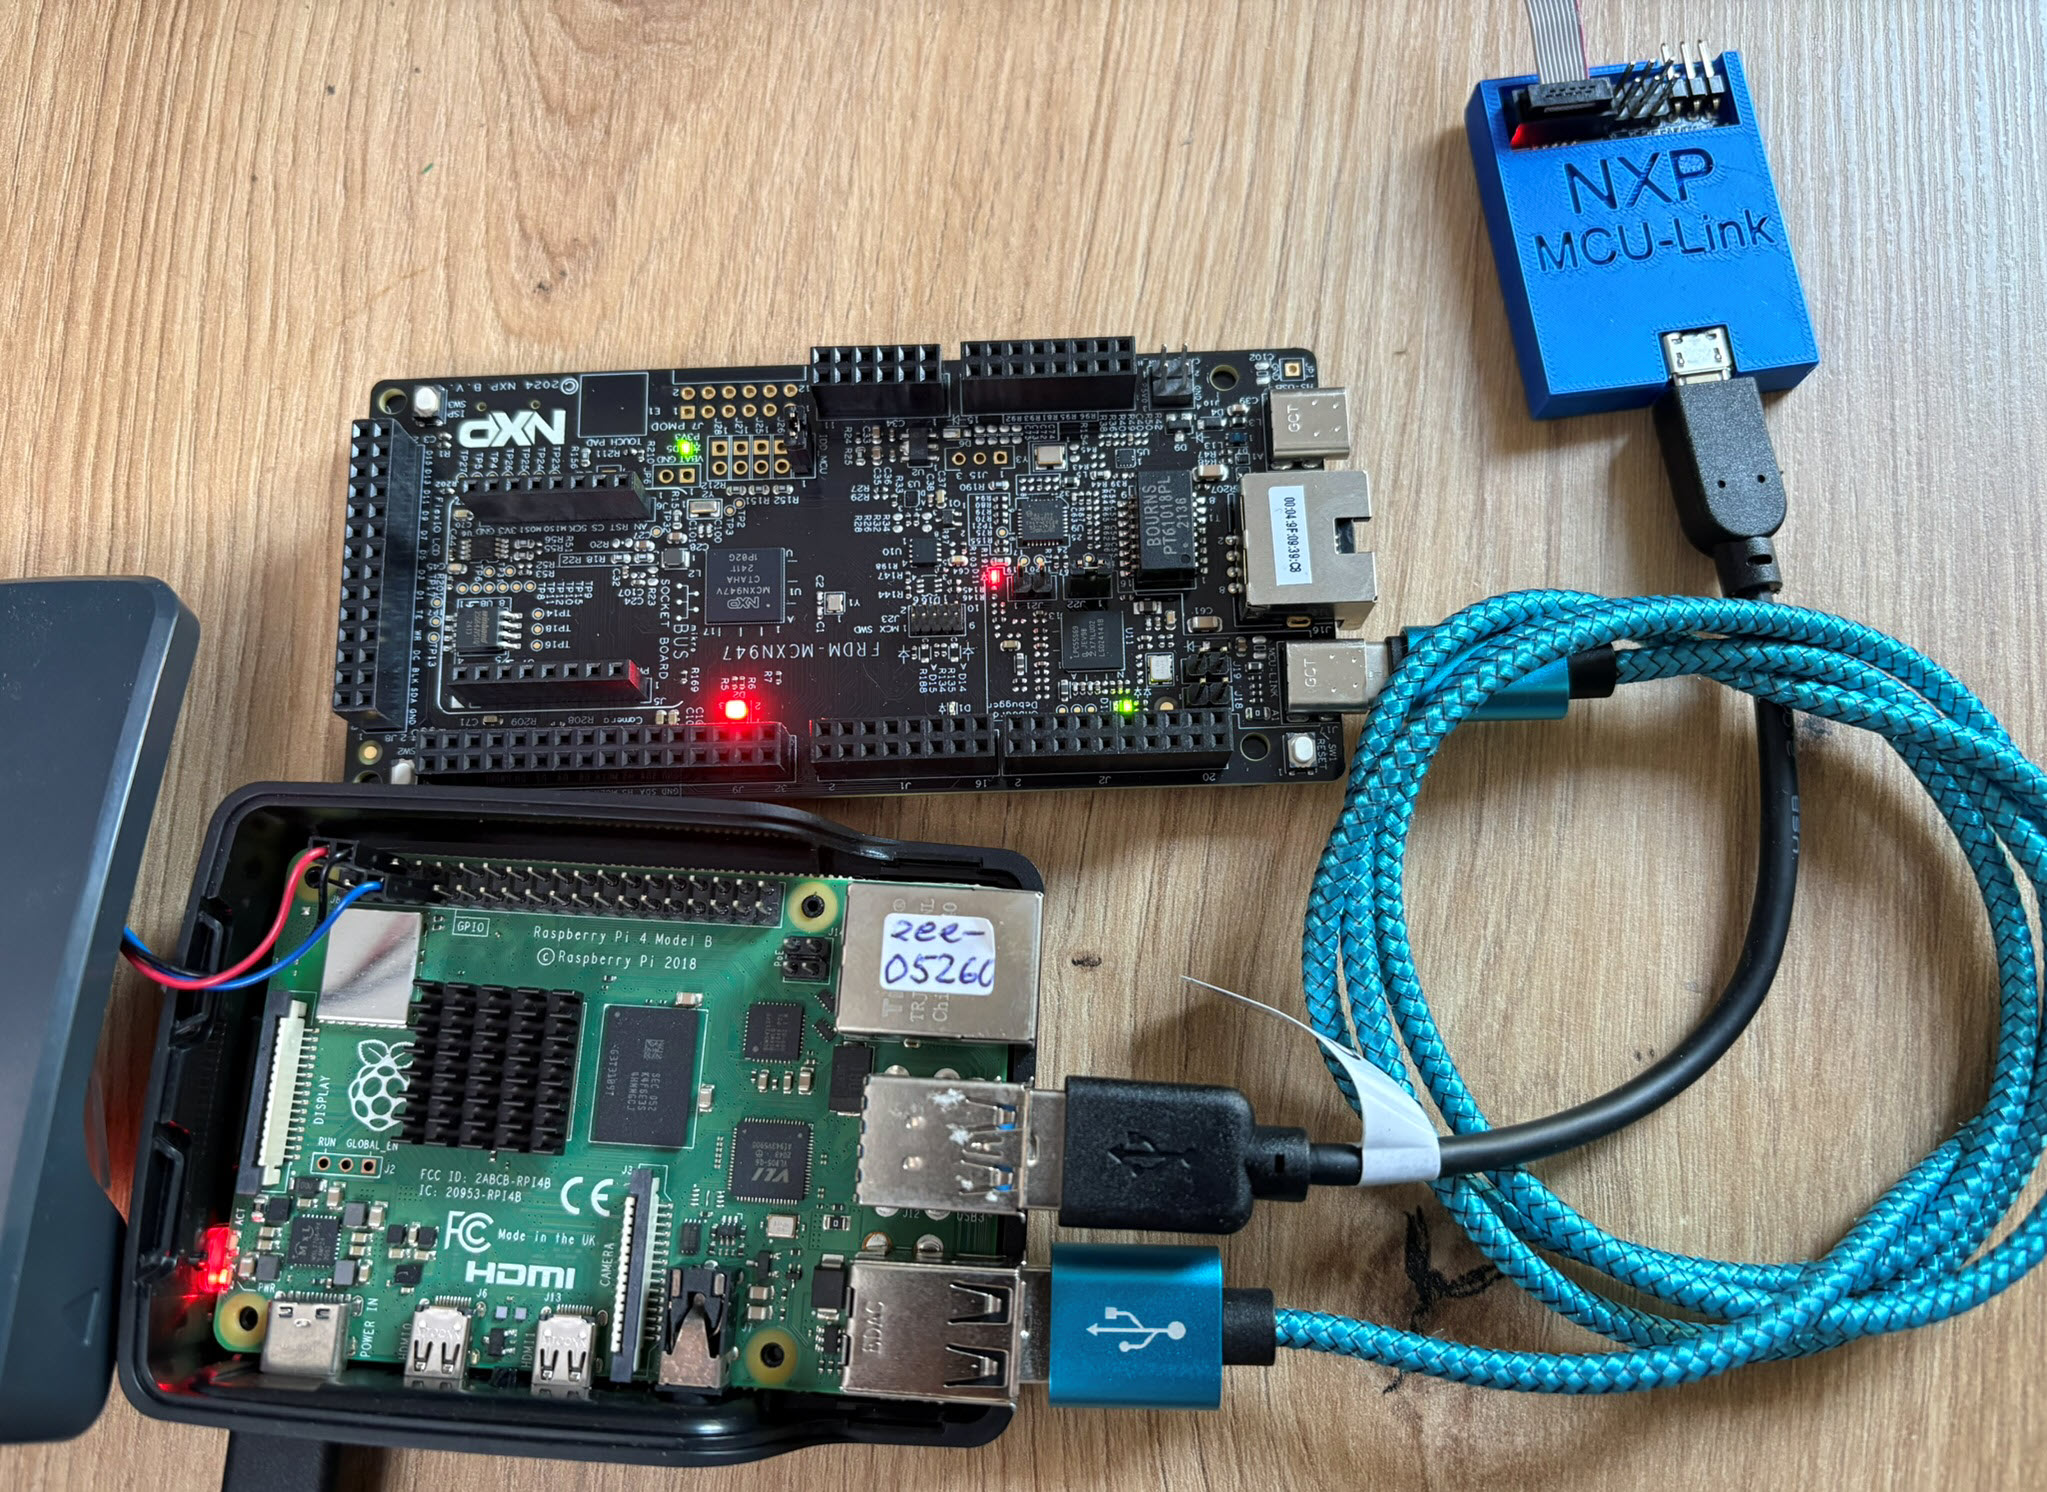
The latest release of the NXP LinkServer supports ARM 64bit (Debian) besides Windows, Linux and MacOS. With this, I can now develop on an NXP i.MX board. Plus, this enables an inexpensive way for automated on-target tests and CI/CD.

The latest release of the NXP LinkServer supports ARM 64bit (Debian) besides Windows, Linux and MacOS. With this, I can now develop on an NXP i.MX board. Plus, this enables an inexpensive way for automated on-target tests and CI/CD.
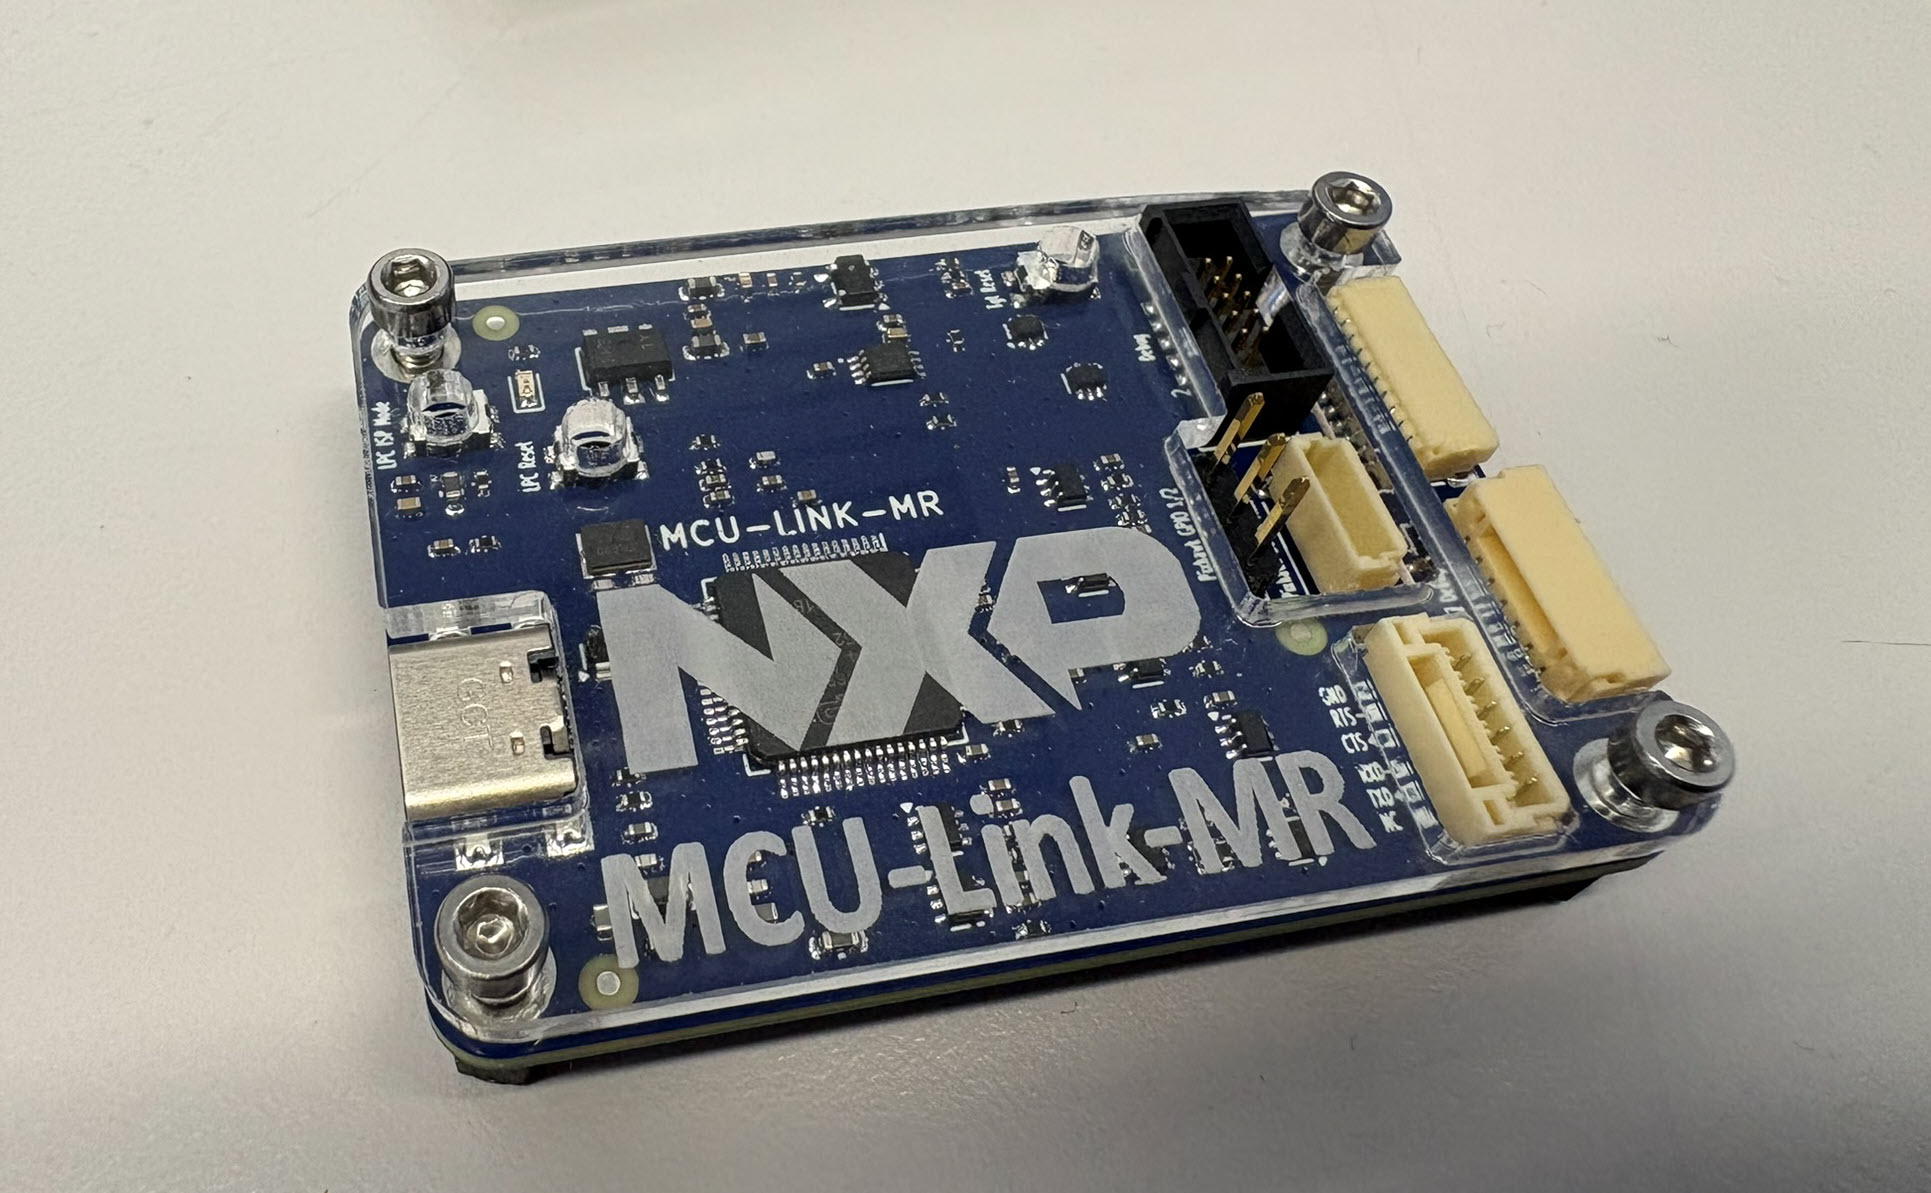
The new v0.5 MCU-Link-MR PCB (see MCU-Link-MR v0.5: Enhanced Debug Probe for ARM Cortex-M) comes with an extra pin header for logic analyzer signals. Because of this I have updated the enclosure for it:
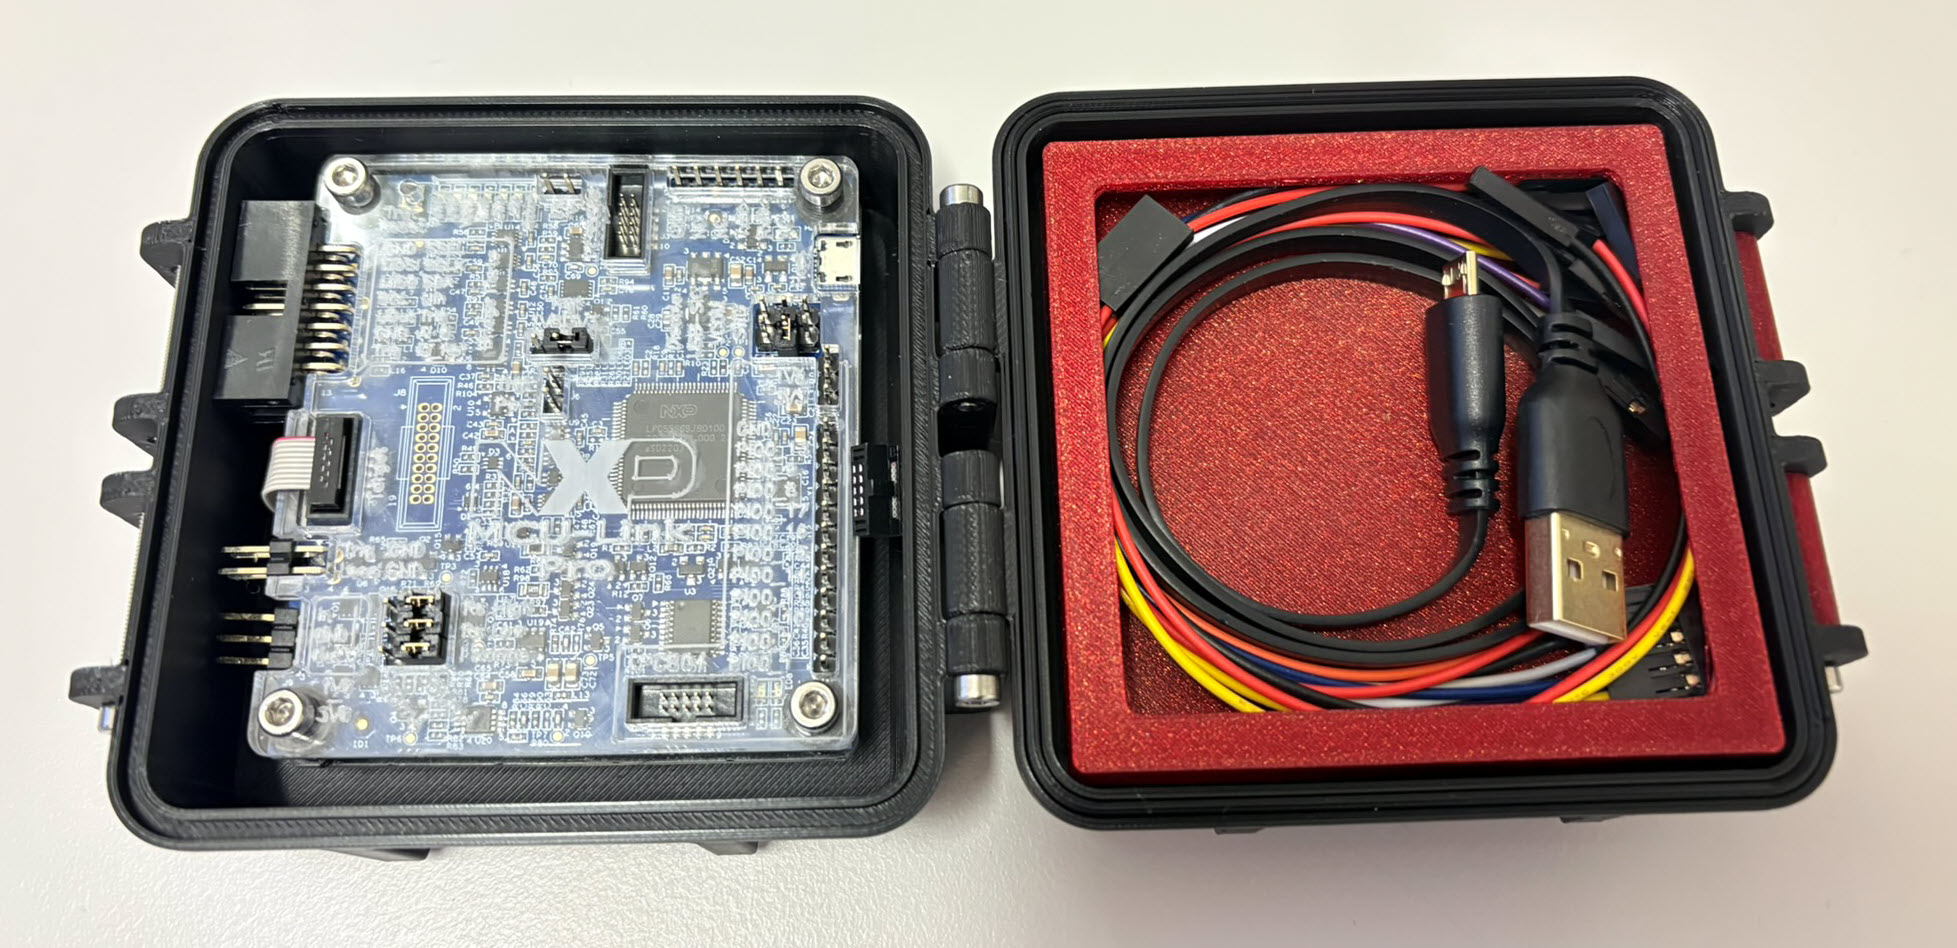
The 3D Printed Rugged Enclosure for NXP MCU-Link Debug Probe has been very useful. I wanted to design something similar for the ‘MCU-Link Pro‘ version of that debug probe. There there is already a laser-cut enclosure for the probe itself. I used the same stack-able rugged box for the debug probe plus all the cables.
The MCU-Link-MR debug probe has been updated :-).
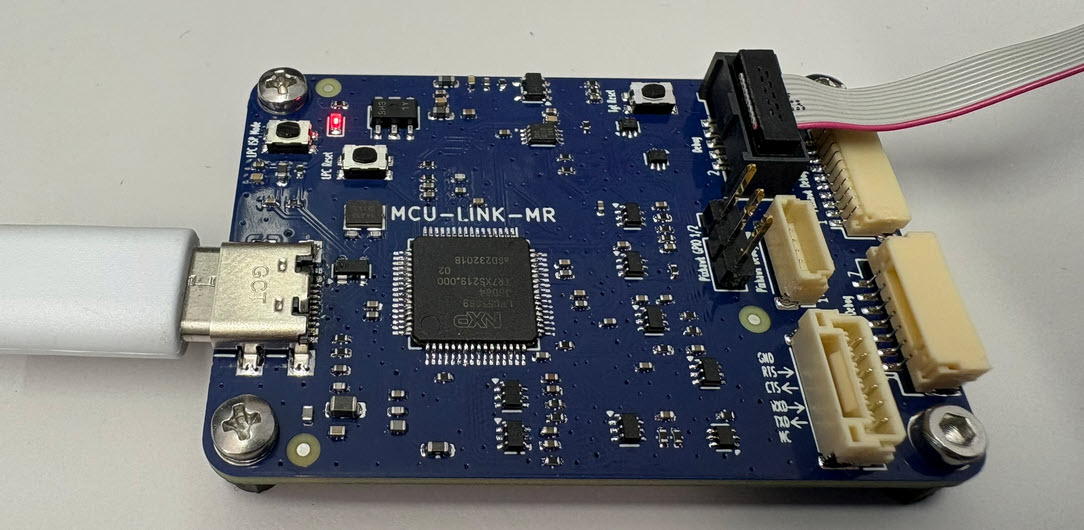
The MCU-Link-MR is a CMSIS-DAP debug probe for ARM Cortex-M devices with extra features for mobile robot and drone debugging. The project is open source and available on GitHub with KiCAD files and BOM.
Continue readingI’m using the NXP MCU-Link CMSIS-DAP debug probe in many of my projects. The debub probe from NXP does not come with an enclosure. I’m traveling to work by train, so I designed a new rugged box and enclosure. The box is small and I can keep all parts inside it.

Sometimes, all what I have is a ELF/Dwarf binary, and I need to debug it. I don’t want to build it, only debug it. The NXP VS Code extension makes that possible. I simply import the binary and start debugging.

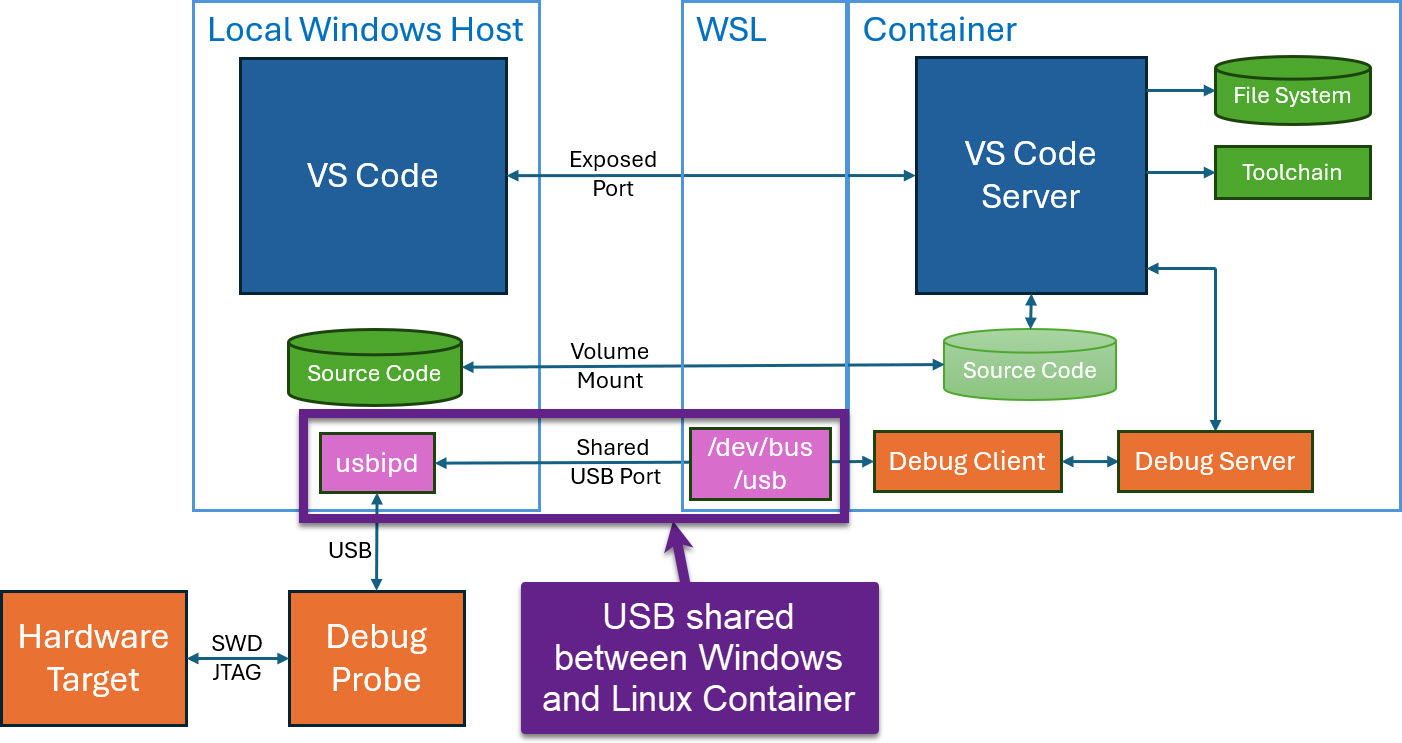
Docker or Development Container are great for isolation. And they work very well with things outside which are TCP/IP based. But most debug probes are USB only. Docker container don’t work well with USB. In Remote Debugging with DevContainer and VS Code, I showed how to use USB based debug probes. I demonstrated using them with an IP connection. In this article I show how Windows USB devices can be used from a container, with the help of usbipd.
Today’s projects and systems get more and more complex. Many systems include multiple MCUs, connected with a field bus or network, for example CAN. For example there can be up to 70 CAN nodes in modern cars. Such larger and connected systems are a challenge for debugging.
Traditional hardware debugging requires a hardware debug probe, connected with a dedicated SWD/JTAG debug cable to the target device. This needs dedicated pins on the target device plus physical access to the device itself. In many cases, this is not possible in the final product. The hardware debug probes, cables, pins and high speed signals are costly. And worse they can introduce new problems and are prone to interference.
If there is a field bus like CAN connecting all the MCUs, why not use it for hardware debugging? Hardware debugging meaning programming the FLASH memory, halt the MCU, inspect the memory and registers, and step through the code?
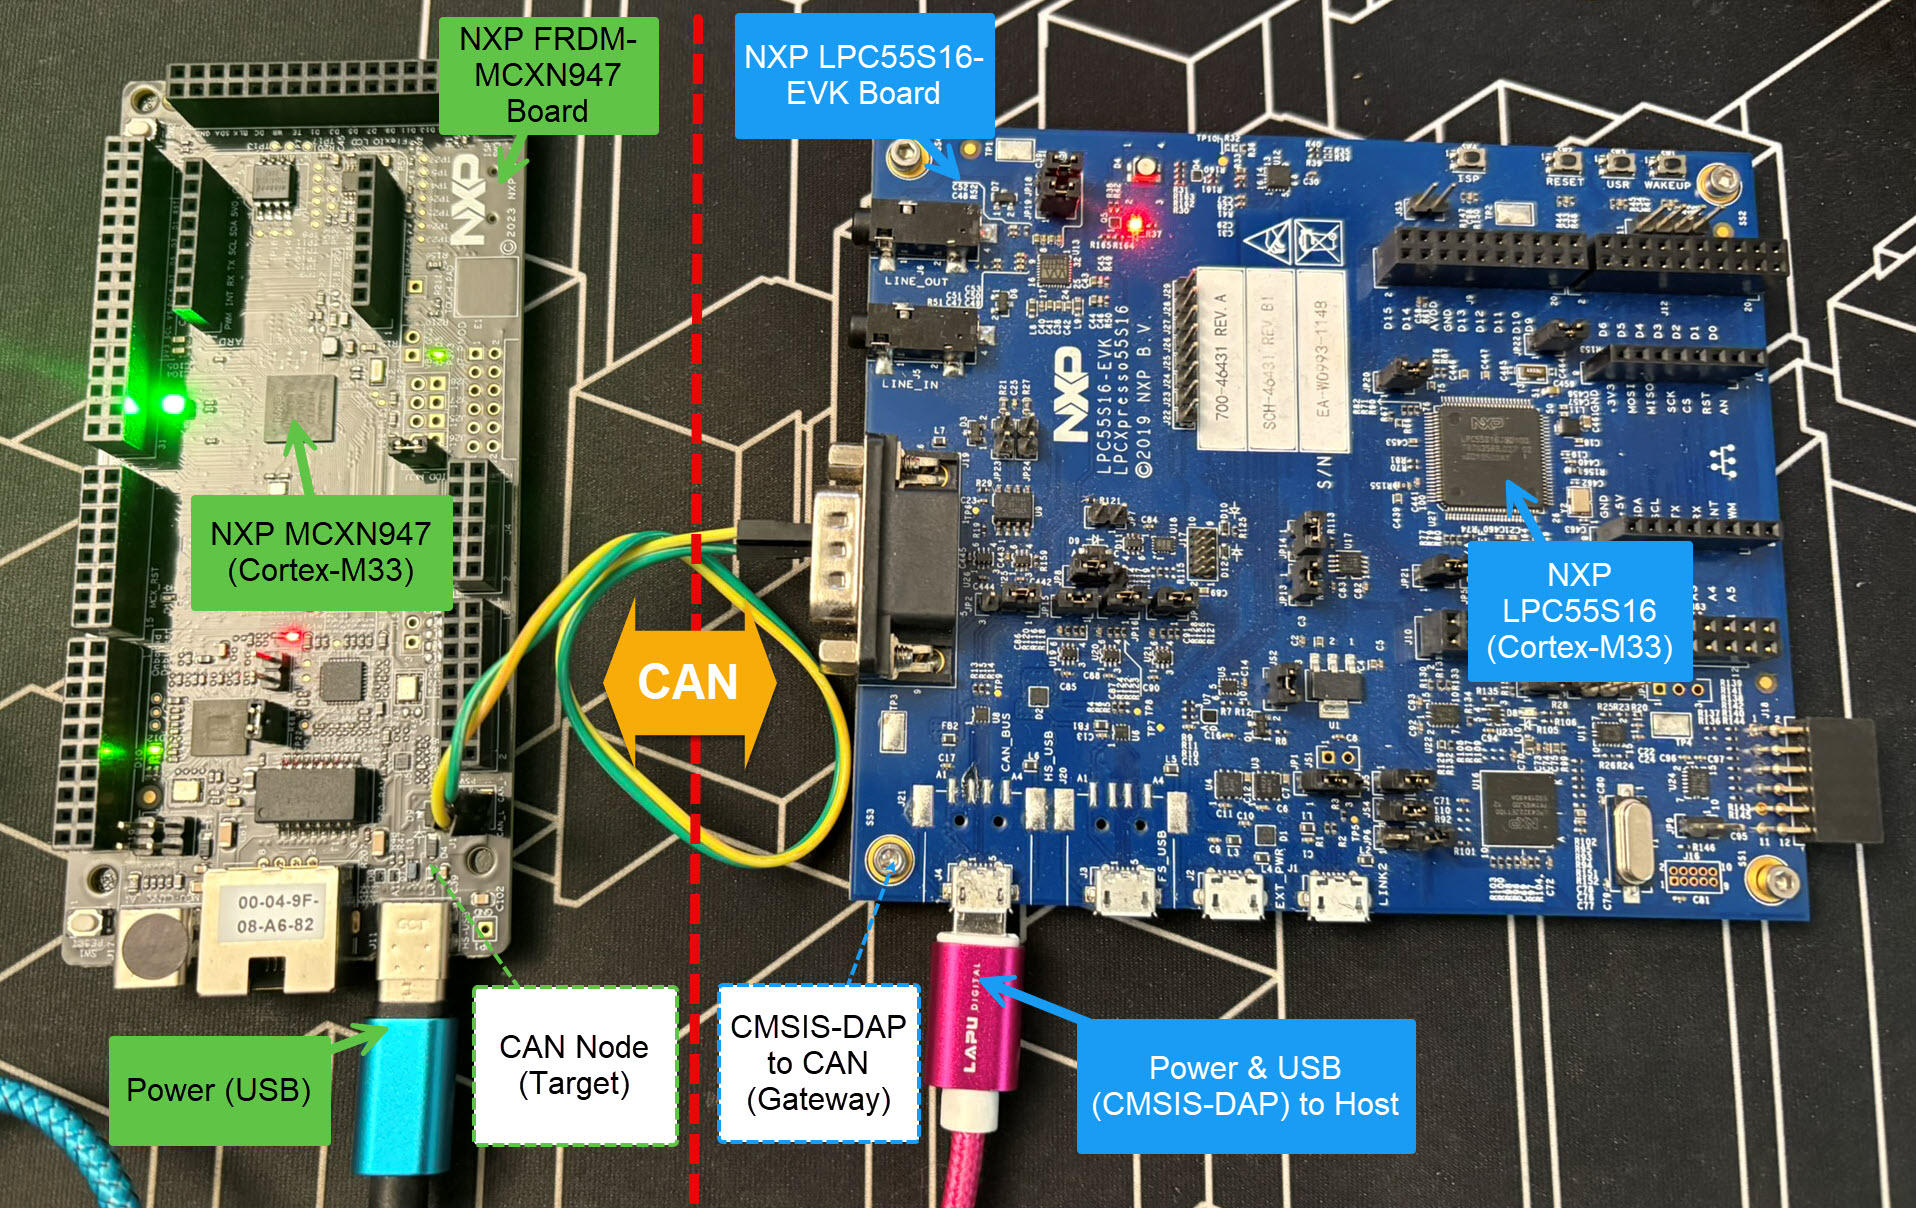
Yes, we can! With the help of a rather unknown hardware feature on ARM Cortex-M devices. We can use the ARM DebugMonitor Interrupt to control and debug the target system. As we would use a JTAG/SWD connection. Instead, we use the CAN bus :-).
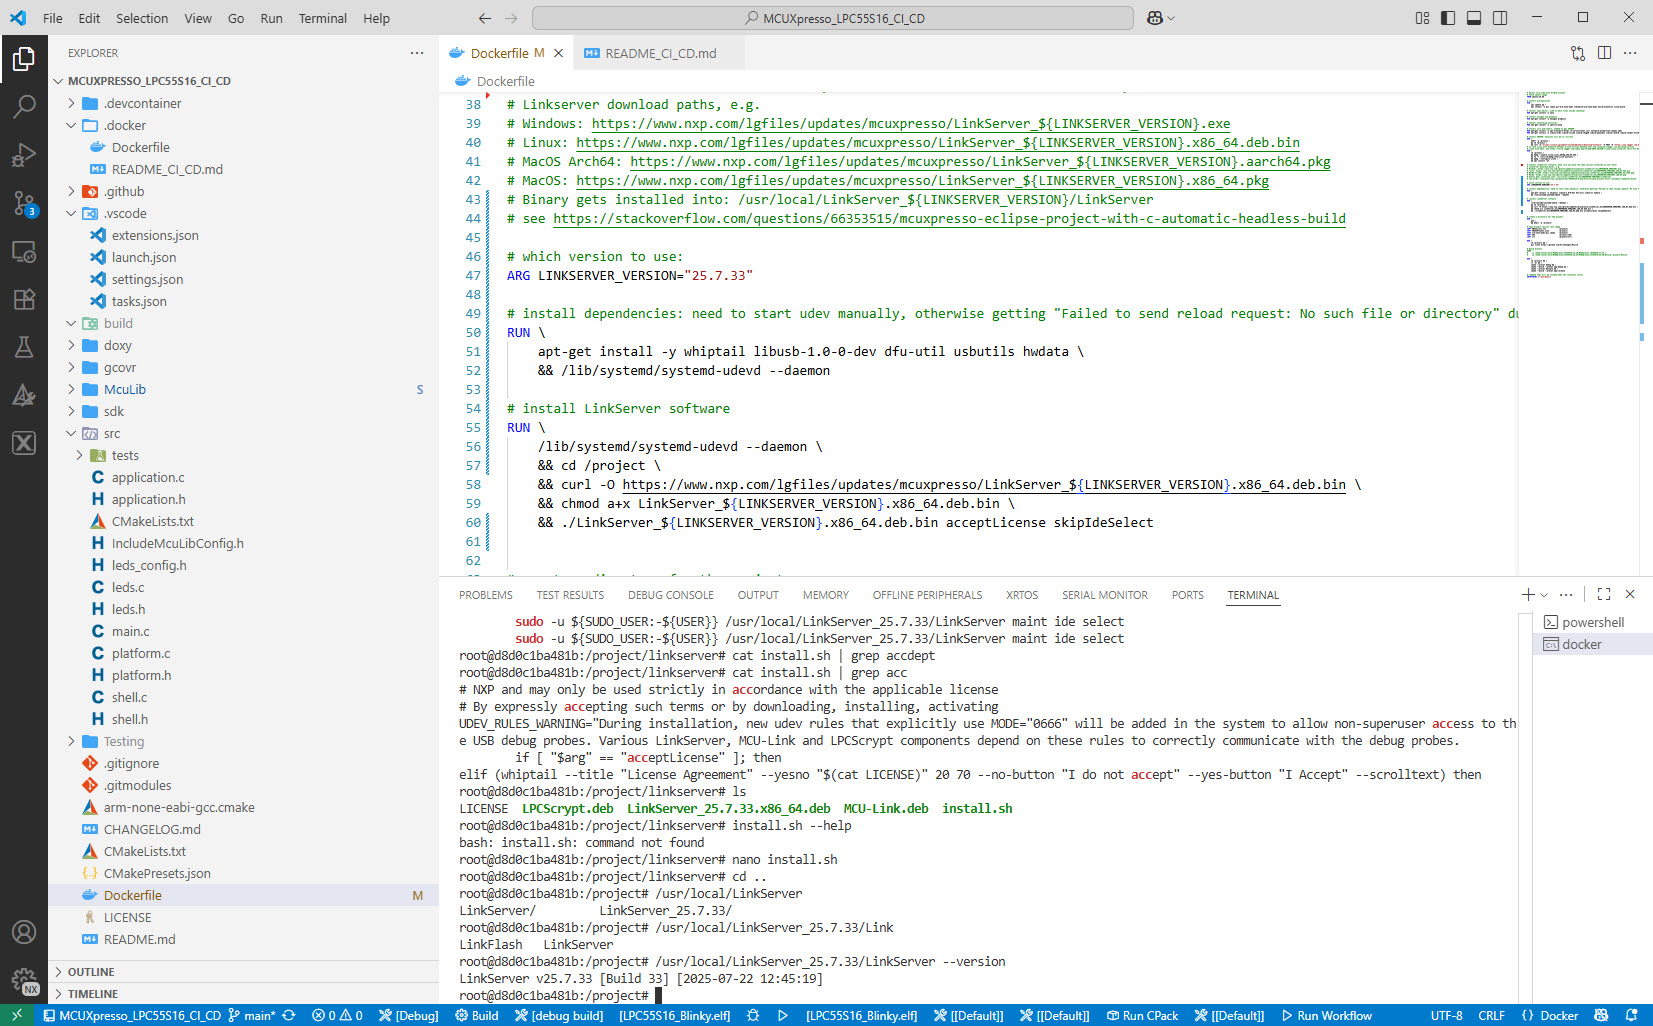
Continue readingI’m shifting more and more of my CI/CD testing infrastructure using the LinkServer runner. One reason is the LinkServer runner can run the test on-target. It can also collect GNO gcov coverage information at the same time. LinkServer is a suite of software tools for launching and managing GDB servers for NXP debug probes.
Usually, I run applications in the micro-controller FLASH memory. But for a CI/CD or testing environment that is not the best choice.
It is possible to have a ‘RAM target’, where the application is running in RAM instead of FLASH memory. This has the advantage not to ‘wear-out’ the FLASH memory. Plus loading and running in RAM is faster. This makes having RAM targets especially useful for testing.
In this article I’m using the NXP LPC55S16-EVK board, but any other target or board is applicable.

