I’m shifting more and more of my CI/CD testing infrastructure using the LinkServer runner. One reason is the LinkServer runner can run the test on-target. It can also collect GNO gcov coverage information at the same time. LinkServer is a suite of software tools for launching and managing GDB servers for NXP debug probes.
Usually, I run applications in the micro-controller FLASH memory. But for a CI/CD or testing environment that is not the best choice.
It is possible to have a ‘RAM target’, where the application is running in RAM instead of FLASH memory. This has the advantage not to ‘wear-out’ the FLASH memory. Plus loading and running in RAM is faster. This makes having RAM targets especially useful for testing.
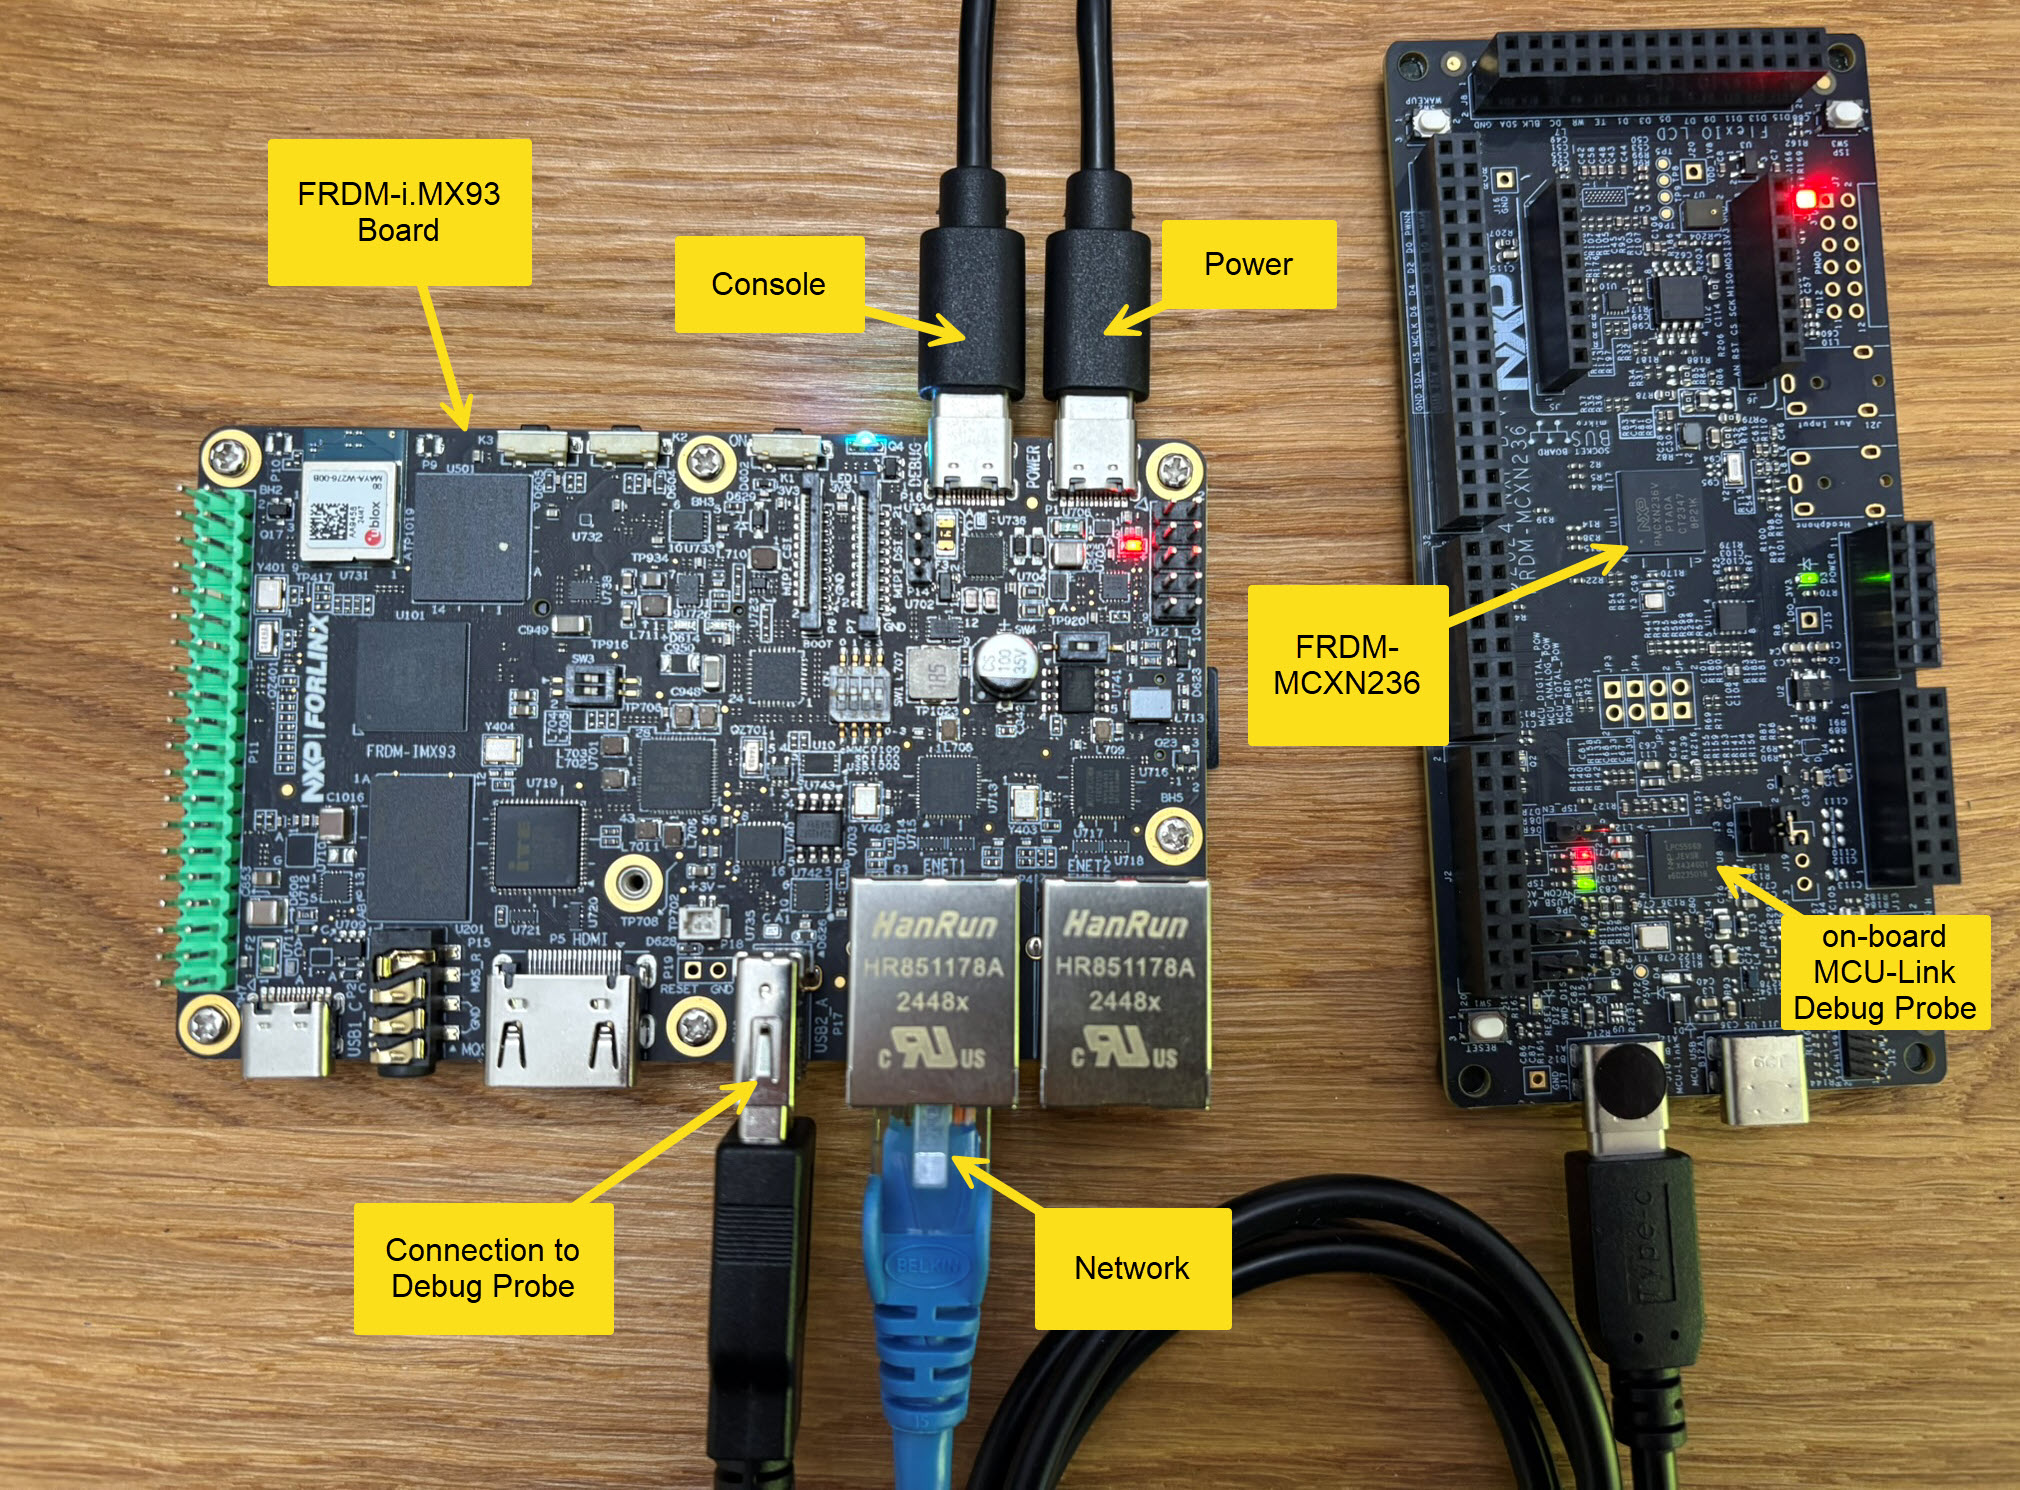
In this article I’m using the NXP LPC55S16-EVK board, but any other target or board is applicable.
Remote debugging an embedded target is very useful: I don’t need a direct debug probe or USB cable connection. Instead, I’m using a network connection (wired or even wireless) over TCP/IP to talk to the debug probe and target. That way I can place the debug probe and target system away from my desk.
In Remote Debugging with USB based JTAG/SWD Debug Probes I showed how normal USB based debug probes can be used. This approach uses a remote host machine (e.g. desktop machine or notebook). This approach is still expensive, not scalable and the host machine needs a lot of space too.
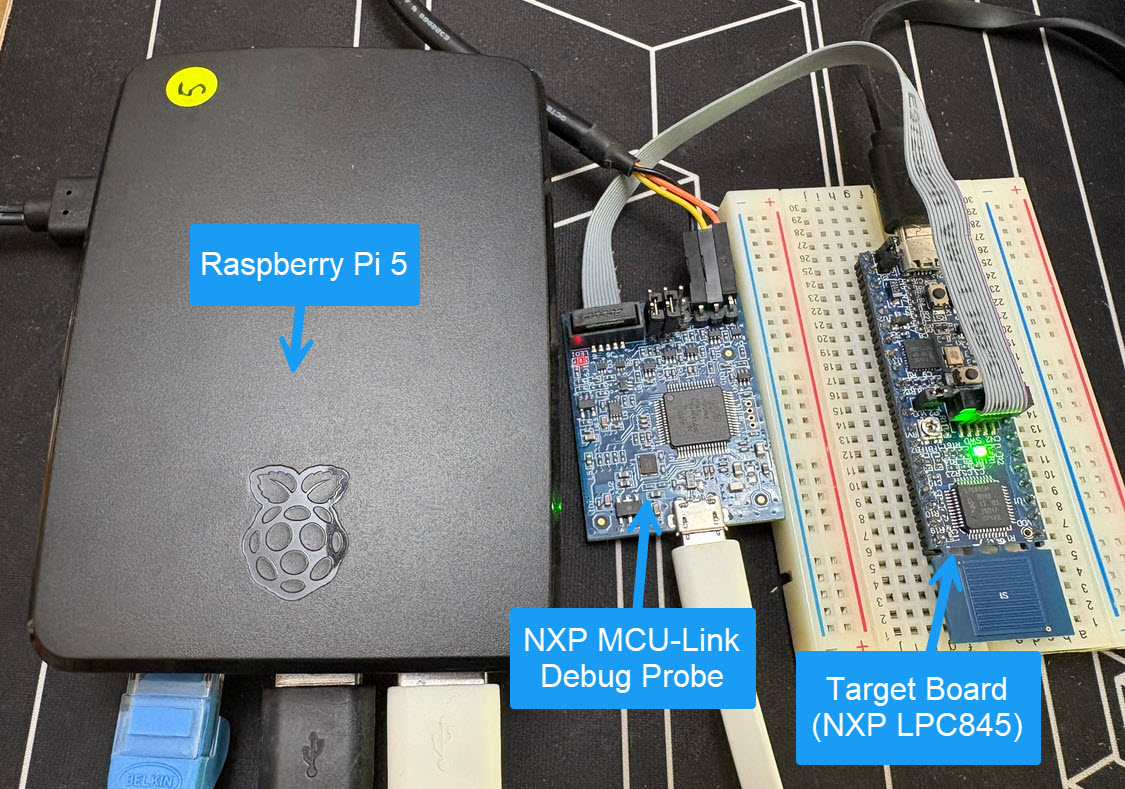
So what if I use a Raspberry Pi instead? The RPi is small, inexpensive and ideal for such a task. Additionally, I can easily use it to build a test or debug farm. In this article, I show the use of the Raspberry Pi for remote debugging. A sub $20 or embedded target debug probe can be employed.
Raspberry Pi with NXP MCU-Link for Embedded Target DebuggingContinue reading →
The MCU-Link-MR from NXP is a CMSIS-DAP debug probe. It includes dedicated connection headers found on mobile robotic systems. These systems include the Pixhawk/PX4 drone and robotics hardware.
FreeRTOS has a great performance measurement feature built-in: Performance counters. At each context switch, the RTOS can do a bookkeeping of time spent in tasks. With this, it can estimate the runtime distribution between the tasks. A very useful feature to get a feeling what the tasks are doing.
But I noticed that with recent FreeRTOS versions, VS Code extension have issues showing the correct runtime counter values:
Unknown Runtime Counters in VS Code Extension (mcu-debug.rtos-views)Continue reading →
This is the second part describing how to use DevContainer for embedded applications with VS Code.
In Optimizing Embedded Development with VS Code and DevContainer I use VS Code with a docker ‘development’ container. The container is created with a recipe to install the development tools and SDK. With VS Code and DevContainer I have the same developer experience as I would develop locally on the host.
One thing not addressed in that earlier article is debugging. Using USB debug probes like a SEGGER J-Link or NXP MCU-Link is a challenge inside a container. This applies to any other debug probe as well.
The solution is to transform an USB based debug probe into one with a network connection:
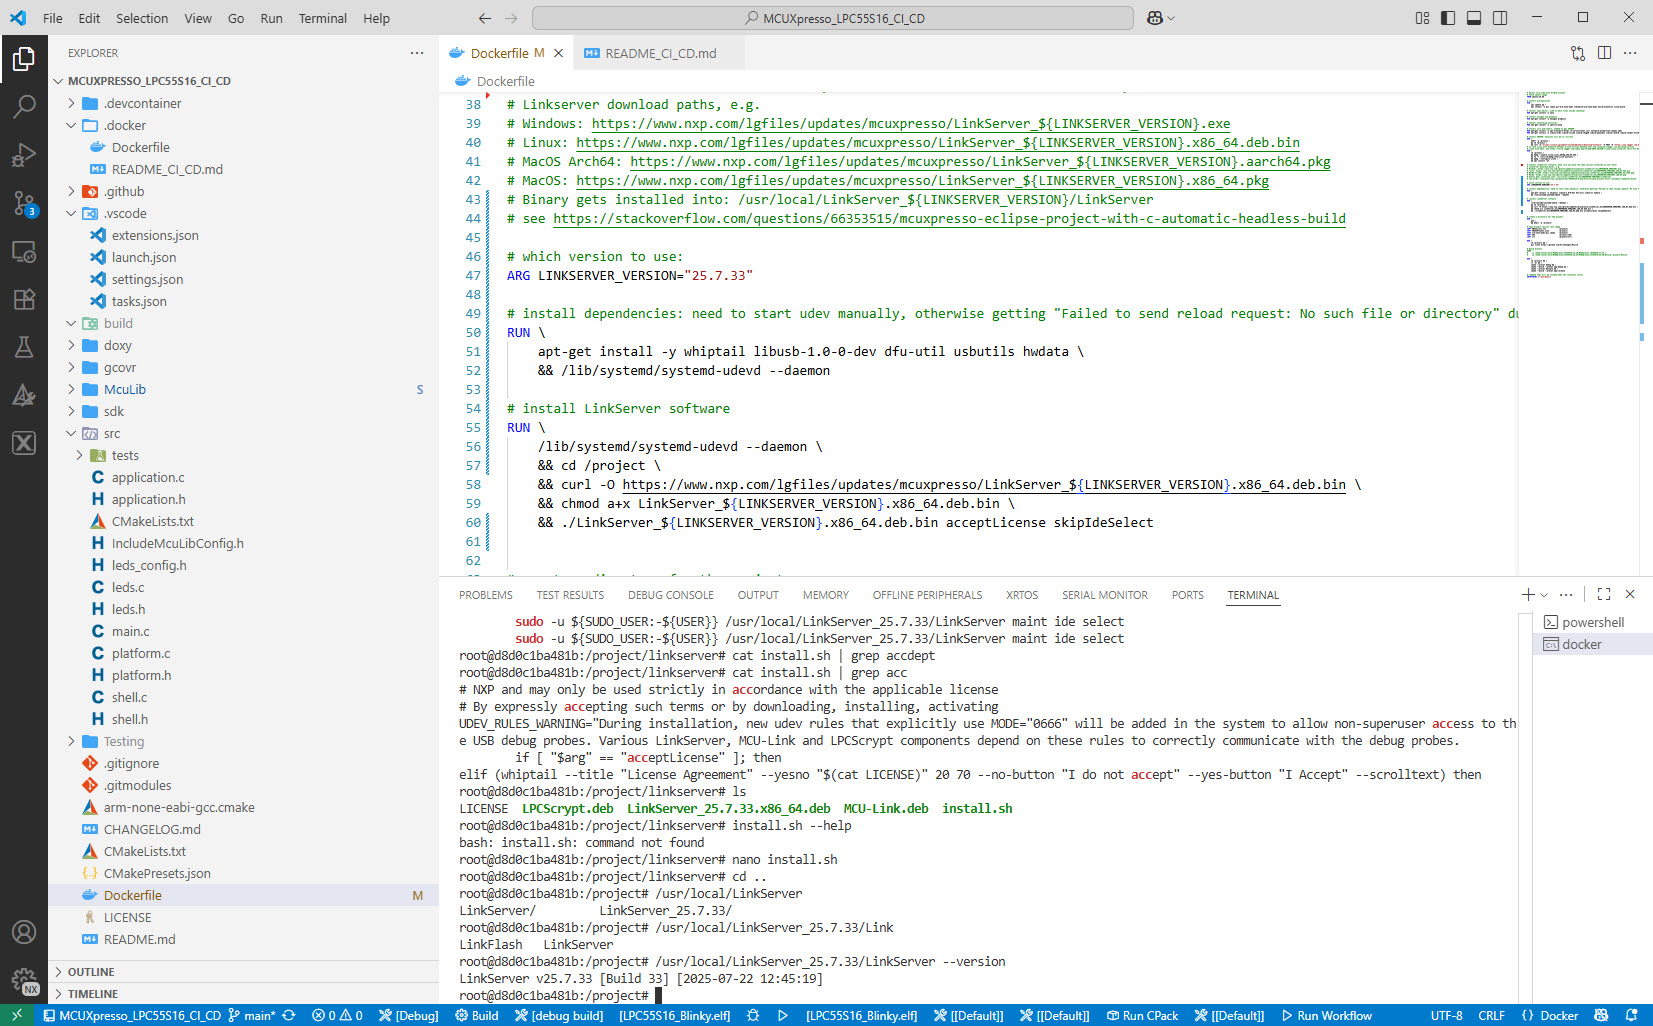
NXP has released a new LinkServer software. It includes an interesting feature. The LinkServer test runner has been extended with a Semihosting console. This is not only very useful for on-target testing. With the Semihosting console, I have a bidirectional communication channel with the target. And I do not need any hardware pins or to run a debug session. All what I need is the CMSIS-DAP connection with the NXP LinkServer runner to have a command line shell:
NXP has released a new version of the LinkServer software. This is a utility for debugging and using scripting for a wide range of devices and debugging probes. It includes support for the MCU-Link, LPC-Link2, on-board and CMSIS-DAP based debug probes with the ‘LinkFlash’:
Programming with LinkFlash
With the new release, it includes a graphical user interface (GUI) for flash programming. It also includes erasing, verifying, recovery, and saving the memory to a file.
The GNU Coverage (gcov) is a source code analysis tool, and is a standard utility in the GNU gcc suite. It works great in a hosted environment (e.g. Linux or Windows), where you have plenty of resources and a file system. But the gcov tools is relevant and usable for restricted embedded systems too. I have used it for years with the help of debug probes and file I/O semihosting. But semihosting does not come for free, depends on a library with support for constructors and destructors, plus relies on file I/O.
Fortunately, there is a way to use gcov without debugger, semihosting, file I/O and special system initialization: using a freestanding environment:
gcov in freestanding environment with embedded target
This article explains how to collect coverage information using a data stream for example over UART or USB-CDC. Key benefits are less code side, no need for a debugger or on-target file system, improved performance, better automation and flexible data collection.