I recently upgraded from Win10 to Win11. Windows 10 was not great for building performance compared to Linux. And I feel that with Windows 11 things got worse too.
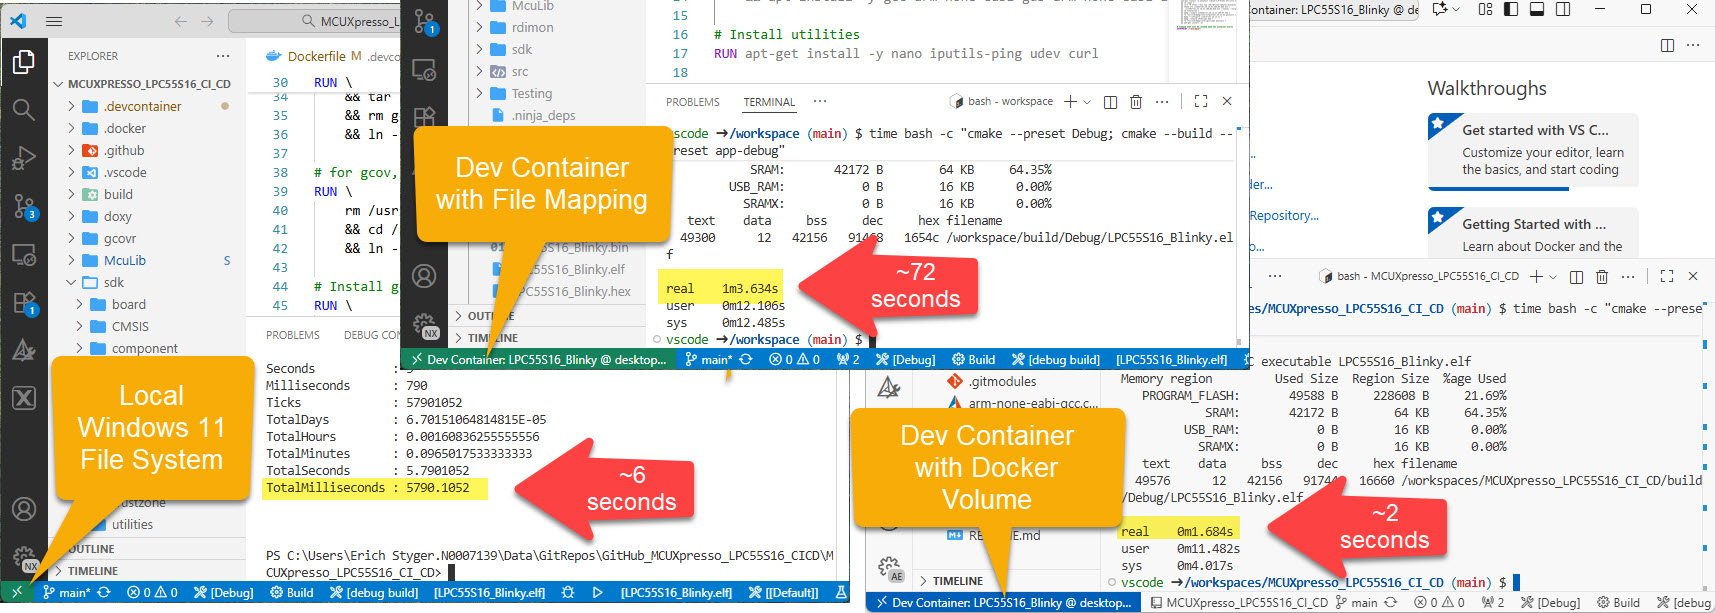
Dev Container in VS Code uses docker-based environments. This enables me using a full-featured development environment, with isolated dependencies. This is especially very useful for development in the embedded systems space. There I have to use many different SDKs, toolchains and libraries. Using Dev Containers is super easy. But file I/O operations with building etc/is not that great.
The solution is to use a Docker Volume with VS Code and Dev Container: