Remote Debugging with DevContainer and VS Code

This is the second part describing how to use DevContainer for embedded applications with VS Code.

In Optimizing Embedded Development with VS Code and DevContainer I use VS Code with a docker ‘development’ container. The container is created with a recipe to install the development tools and SDK. With VS Code and DevContainer I have the same developer experience as I would develop locally on the host.

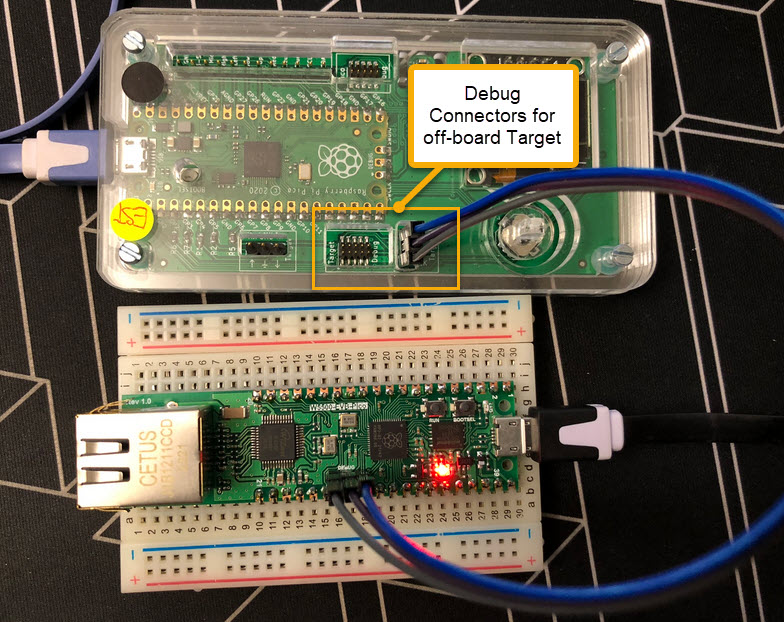
One thing not addressed in that earlier article is debugging. Using USB debug probes like a SEGGER J-Link or NXP MCU-Link is a challenge inside a container. This applies to any other debug probe as well.

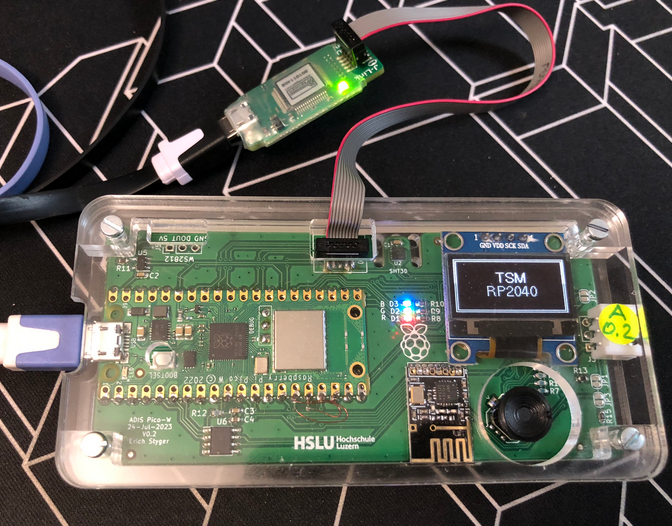
The solution is to transform an USB based debug probe into one with a network connection:

VS Code DevContainer with Hardware Debugging

In this article, I show how to do this.

Continue reading

Optimizing Embedded Development with VS Code and DevContainer

Embedded System have a lifetime of 10 or 15 years. During that time the software and tools has to be maintained. This can be very challenging. Who knows if that compiler or tool used is still available in 10 years from now? Additionally installing and configuring the tool chain and environment for a new team member is difficult. Even worse: using a different host operating system for the cross development can produce different results or introduce issues.

VS Code running with DevContainer

One solution for all these problems is to use Docker images and containers. I can pack all the necessary tools and software into a virtual environment and container. But developing inside a container comes with many challenges. In this article I’ll show how Visual Studio Code or VS Code makes working with containers very easy. In this article I show how easy it is to use modern development tools and methodologies for embedded development.

Continue reading

Automated On-Target Testing with J-Run’s –args Feature

SEGGER has released a new version of their J-Link tools suite. That suite includes the J-Run utility which loads, executes and monitors the output of the target. Output can be with RTT (Real-Time Transfer) or semihosting. This makes it useful for automated tests with CMake and CTest:

CTest with J-Run

What has been added from the V7.98g release is the ability to send arguments to the running application using the --args command, for example with CMake/CTest:

set (RUNNER_CTEST_COMMAND "$ENV{SEGGER_PATH}/JRun" --verbose --device LPC55S16 --silent --rtt -if SWD)

add_test(
NAME Led_1
COMMAND ${RUNNER_CTEST_COMMAND} --args "Led_1" ${TEST_EXECUTABLE}
)

Like applications running on the host, I can now pass arguments to the running application. This is useful to set up the target, or to tell which kind of tests to run.

Continue reading

How to Use SystemView Data Plot Feature for Real-time Data Visualization

There is a new feature in the SEGGER SystemView: the ability to plot any data provided by the application, for example sensor data or any other useful data:

SEGGER SystemView with Data Plot
Continue reading

Modern On-Target Embedded System Testing with CMake and CTest

One key element of a CI/CD pipeline is the automatic testing phase: whenever I check in new source code or manually trigger it, I can run a test suite to make sure that the changes do not break anything. For this, I have to run automated tests. For an an embedded target, it means that I have to run some tests on the board itself too.

CTest with VS Code
Continue reading

Debug Probes for RP2040 with VS Code

For systematic debugging, an engineer needs a debug probe. For the Raspberry Pi Pico (RP2040) device there are plenty of debug options with VS Code.

In this article I show different options, from professional tools to DIY solutions and the settings in VS Code I’m using.

Continue reading

Semihosting with VS Code on RP2040

With semihosting I can use standard I/O function like printf() and I can read and write data on the host through the debug connection. If used with care, this is a great feature especially for unit testing.

Raspberry Pi Pico-W (RP2040) board
Continue reading

Selecting J-Link Debug Probe by Nickname

I have lots of hardware and debug probes on my desk, and I discussed using nicknames for debug probes to better identify them.

‘Green’ and ‘Yellow’ Robots and J-Link Probes

So far so good. At that time of the previous article, it was possible to assign nicknames to J-Link debug probes, but not to use the nickname instead of the USB serial number. Well, SEGGER was fast again, and responded with a new J-Link software pack version 7.92d which implements that features: I can now use the nickname to connect to a debug probe :-).

Continue reading

New SEGGER J-Link-OB LPC4322-based Firmware with Target Power

Sometimes I have a wish. Not every time it gets fulfilled. But this time I’m lucky and happy developer. A few days ago I wrote about the LPC4322-based SEGGER OB (on-board) J-Link firmware. It works great, but the board requires another USB cable to power the target board.

Rolf Segger contacted me, and a few days later I had a J-Link firmware with a ‘power-on’ feature:

That way, only one USB cable is needed. All what you need to do is to update the firmware.

Continue reading

Upgrading LPC4322-based Debug Probe Firmware on RT10xx

Going with the factory default can be fine. But an upgrade could give a performance boost plus added functionality. Many of the NXP i.MX RT evaluation boards have an LPC4322 based debug circuit on it. One example for this is the i.MX RT1010 board.

NXP i.MX RT1010 EVK

On such boards, one of the first steps I do is: upgrading the firmware and change it to a better option: improved speed, SWO support plus avoiding issues with the USB MSD device.

Continue reading