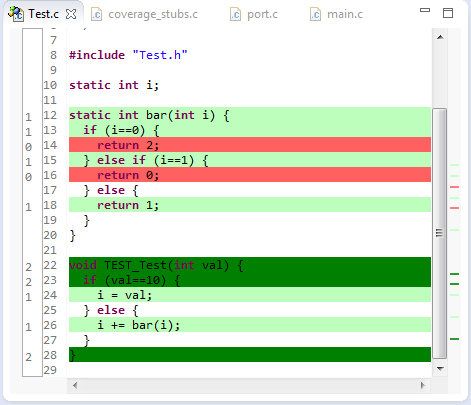
Test coverage is a very useful metric: it tells how much of your code has been covered by tests. Or the other way: it helps identifying areas of my code which has not been running tests. A new CMake extension in VS Code is available. It works with the new NXP LinkServer test runner to allow running tests on an embedded target. The really cool thing is: it collects and visualizes test data with coverage information in a single step:
One topic is still open: how to use semihosting with file I/O using development container? The challenge here is that we need to work with two different file systems.
DevContainer Development with File I/O and Semihosting
In this article I show how semihosting file I/O can be used with DevContainer.
The GNU Coverage (gcov) is a source code analysis tool, and is a standard utility in the GNU gcc suite. It works great in a hosted environment (e.g. Linux or Windows), where you have plenty of resources and a file system. But the gcov tools is relevant and usable for restricted embedded systems too. I have used it for years with the help of debug probes and file I/O semihosting. But semihosting does not come for free, depends on a library with support for constructors and destructors, plus relies on file I/O.
Fortunately, there is a way to use gcov without debugger, semihosting, file I/O and special system initialization: using a freestanding environment:
gcov in freestanding environment with embedded target
This article explains how to collect coverage information using a data stream for example over UART or USB-CDC. Key benefits are less code side, no need for a debugger or on-target file system, improved performance, better automation and flexible data collection.
An important part of every CI/CD pipeline is having a testing phase. In this article I show how to use GNU gcov (coverage) with an embedded target, using Visual Studio Code as front end:
GNU gcov with VS Code
With this, I can run the code on the embedded target which stores the coverage data on the host.
Most host or desktop systems (say Linux, Mac or Windows) have a normal use case where you start the operating system say in the morning and shut it down in the evening, and then you leave the machine. Embedded Systems are different: they are not attended, and they are supposed to run ‘forever’. Not every embedded system needs to run an OS (or in that world: Real-Time Operating System or RTOS), but the same applies here: after the RTOS is started, it is not intended that it will shutdown and restart. To the extend that you won’t they support the ‘shutdown’ and ‘restart’ functionality at all. In case of gathering coverage information this would be really useful:
coverage information from FreeRTOS application
In the case of FreeRTOS: what if I really need to shutdown the RTOS and restart it again, as by default this is not supported. This is what this article is about …
For a research project, we are going to send a satellite with an embedded ARM Cortex microcontroller into space early next year. Naturally, it has to work the first time. As part of all the ESA paperwork, we have to prove that we tested the hardware and software thoroughly. One piece of the that is to collect and give test coverage evidence. And there is no need for expensive tools: Free-of-charge Eclipse and GNU tools can do the job for a space mission 🙂
The GNU tools include powerful utilities to collect coverage information. With coverage I know which lines of my code have been executed, which is a very useful test metric. The GNU coverage tools are commonly used for Linux applications. But to my surprise not much for embedded application development, mostly because it requires a few extra steps to have it available? Why not using free and powerful tools for improving software quality? This article explains how to install the GNU gcov tools into the Eclipse IDE.
The great thing with open source tools like Eclipse and GNU (gcc, gdb) is that there is a wealth of excellent tools: one thing I had in mind to explore for a while is how to generate code coverage of my embedded application. Yes, GNU and Eclipse comes with code profiling and code coverage tools, all for free! The only downside seems to be that these tools seems to be rarely used for embedded targets. Maybe that knowledge is not widely available? So here is my attempt to change this :-).
Or: How cool is it to see in Eclipse how many times a line in my sources has been executed?