It is the last day of November. And tomorrow the Advent starts with December 1st. Over the last weeks I have spent the weekends with building an Advent Calendar. This year it is one without any electronics. The CNC machine has cut a pine wood tree. And the 3D printer created round threaded and numbered containers, with a shiny star on top of the tree:
I recently upgraded from Win10 to Win11. Windows 10 was not great for building performance compared to Linux. And I feel that with Windows 11 things got worse too.
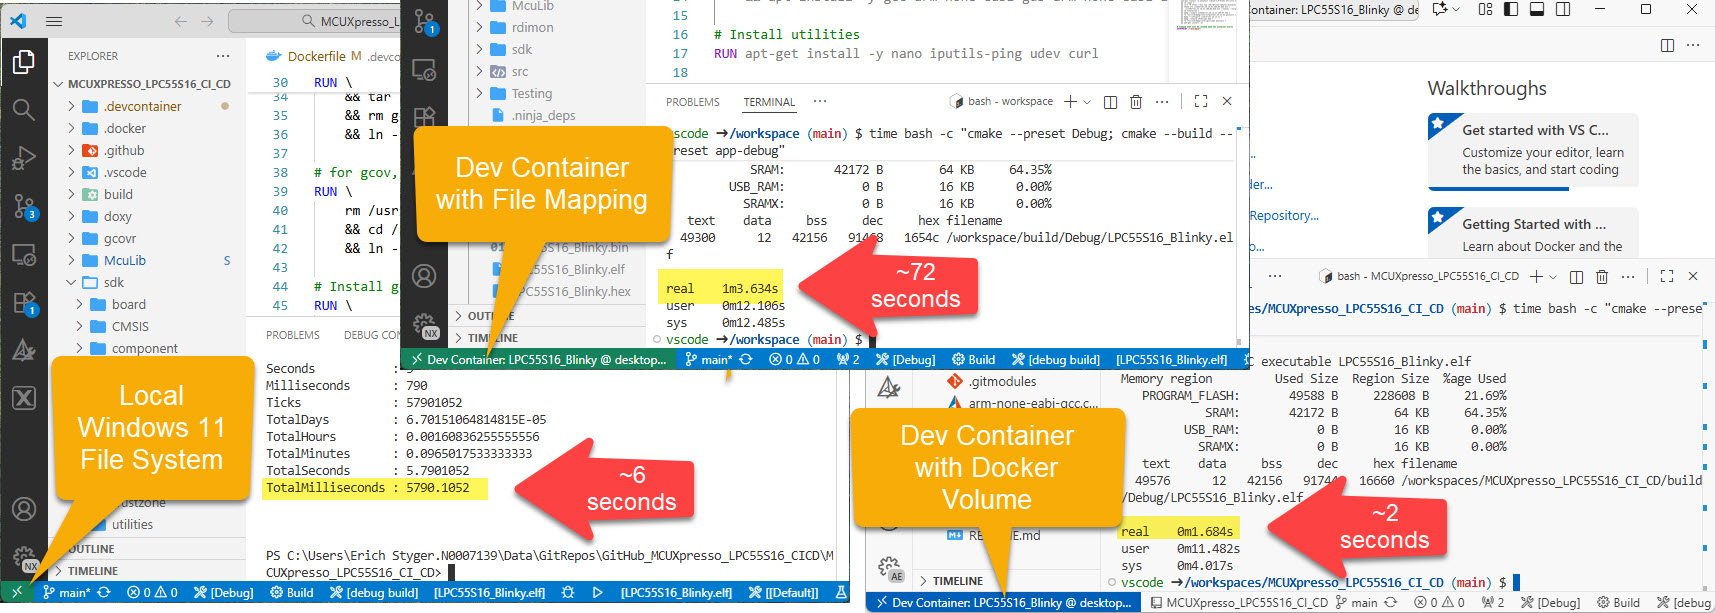
Dev Container in VS Code uses docker-based environments. This enables me using a full-featured development environment, with isolated dependencies. This is especially very useful for development in the embedded systems space. There I have to use many different SDKs, toolchains and libraries. Using Dev Containers is super easy. But file I/O operations with building etc/is not that great.
The solution is to use a Docker Volume with VS Code and Dev Container:
Today’s projects and systems get more and more complex. Many systems include multiple MCUs, connected with a field bus or network, for example CAN. For example there can be up to 70 CAN nodes in modern cars. Such larger and connected systems are a challenge for debugging.
Traditional hardware debugging requires a hardware debug probe, connected with a dedicated SWD/JTAG debug cable to the target device. This needs dedicated pins on the target device plus physical access to the device itself. In many cases, this is not possible in the final product. The hardware debug probes, cables, pins and high speed signals are costly. And worse they can introduce new problems and are prone to interference.
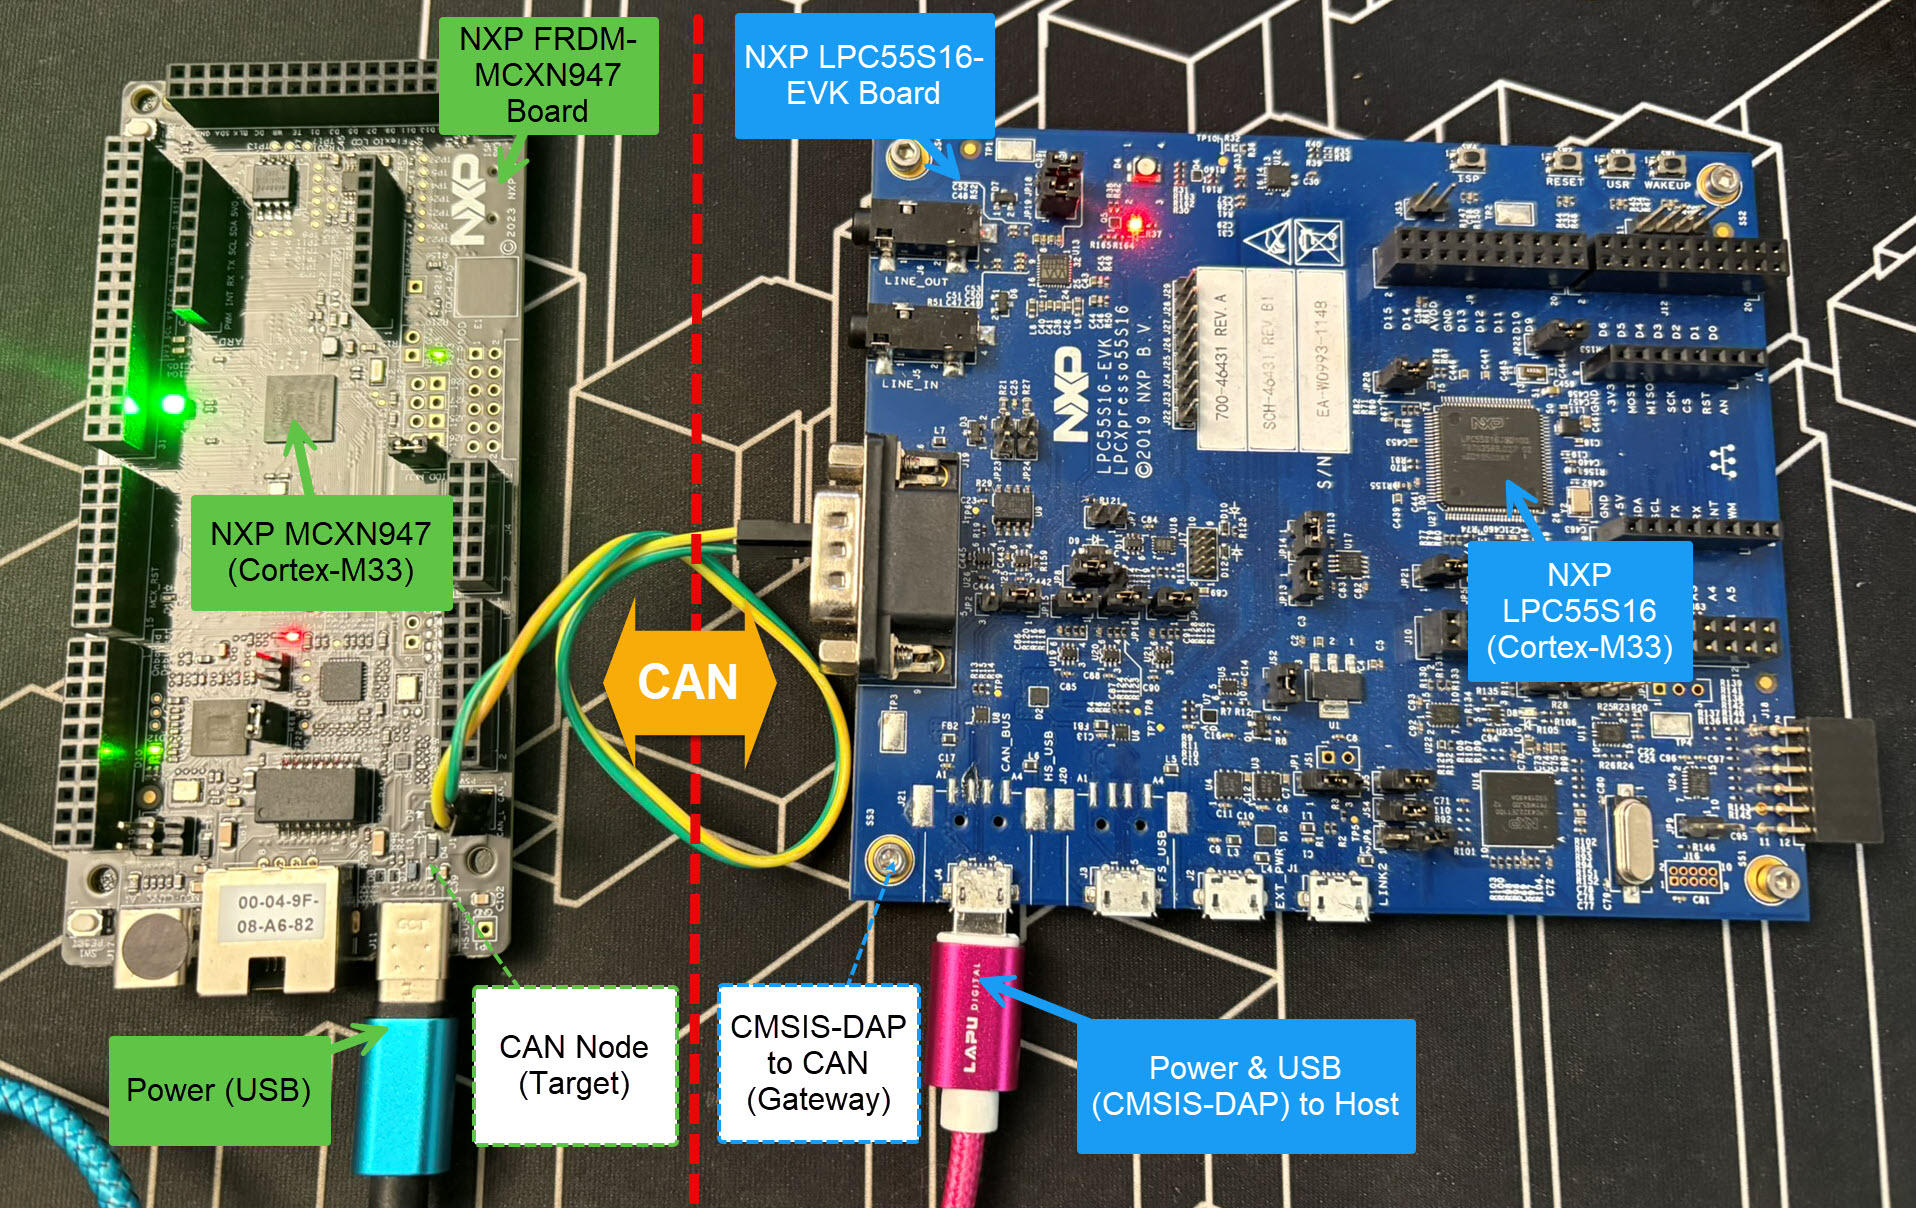
If there is a field bus like CAN connecting all the MCUs, why not use it for hardware debugging? Hardware debugging meaning programming the FLASH memory, halt the MCU, inspect the memory and registers, and step through the code?
Cortex-M Hardware Debugging over CAN
Yes, we can! With the help of a rather unknown hardware feature on ARM Cortex-M devices. We can use the ARM DebugMonitor Interrupt to control and debug the target system. As we would use a JTAG/SWD connection. Instead, we use the CAN bus :-).
The MetaClockClock is a clock made of clocks. It consists of multiple dual-shaft stepper motors, arranged as a matrix of 5×12 analog clocks. Each clock has two motorized hands that can move independently. The clock can tell the time, but in a unconventional way. The entire matrix creates a meta-display that shows the time or other information. Between the updates, the hand can do coordinated, choreographed movements.
The clock hands are laser cut acrylics with get light up with a LED ring around the clock.
This article describes the build with CNC cut oak enclosure, laser-cut parts and 3D printed items.
This article is not about software or an electronics project. It is about a multi-year project transforming a lawn into a home and food for various species. Slugs plus a cat have played a role in this, in one way or another.
SonarQube from Sonar is a free static analysis tool for VS Code. It is able to analyze the source code and find issues. SonarQube does a similar job as other static analysis tools like CppCheck for VS Code.