So now I have carefully set up my compiler include paths in Eclipse to tell the GNU compiler where to find my header files:

Include Paths
The question is: how can I apply these settings to another project?

So now I have carefully set up my compiler include paths in Eclipse to tell the GNU compiler where to find my header files:
Include Paths
The question is: how can I apply these settings to another project?
One of the things missing for Embedded in the GNU linker is that it cannot generate a CRC checksum. Luckily, there is the solution of using SRecord:

If you have read my article “Serial Terminal View with Eclipse Kepler“, then you are aware that using a Terminal view to a serial connection (COM port) under Eclipse Kepler is pretty much broken. I’m moving some of my projects to the more recent Eclipse Luna release, and the good news is that support is back 🙂

Terminal View with connection to board
P&E has upgraded their GDB implementation and interface used in combination with the GNU ARM Eclipse plugins: they support now advanced flash programming options plus the ability to attach/connect to a running target :-). This update is available as Eclipse update.
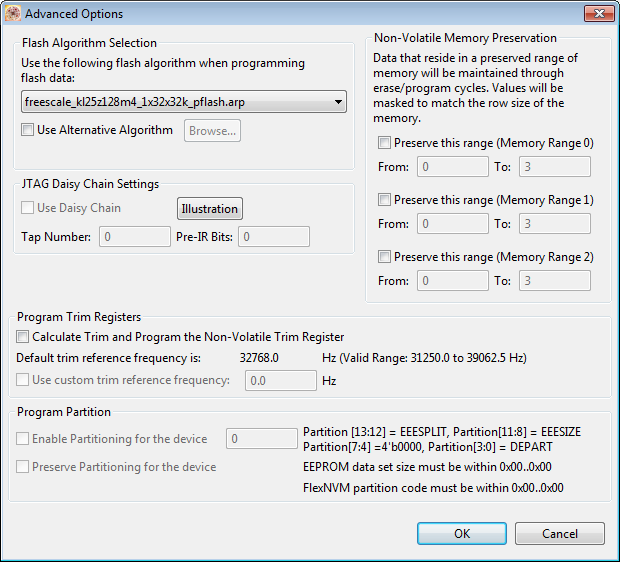
Advanced Options
There are cases where my application runs find for days, weeks or even months, but then from time to time there is an application crash. Yes, the watchdog will recover it, but still it would be good to know what happened? One solution would be to hook up a trace probe (like the one I have described in this post: “First Steps with the P&E Tracelink“). But having such a trace probe attached all the time is first not cheap and second not always possible. So what if the application would leave ‘breadcrumbs’ behind which would tell me the flow of the program leading to the problem? I have found a functionality in the GNU tools which seems not be widely known or use, but is incredibly helpful in such cases.
So what if I could get a log like this telling me which functions get called by whom?
{ 00000E88->00000DA0 ???->DEMO_Init
} 00000E88<-00000DA0 ???<-DEMO_Init
{ 00000E8C->00000D40 ???->DEMO_Run
 { 00000D62->00000CE8  DEMO_Run:0x0022->decide
  { 00000D0E->00000C60  decide:0x0026->calcValue
  } 00000D0E<-00000C60  decide:0x0026<-calcValue
  { 00000D16->00000CA0  decide:0x002E->getValue
   { 00000CC6->00000C60  getValue:0x0026->calcValue
   } 00000CC6<-00000C60  getValue:0x0026<-calcValue
  } 00000D16<-00000CA0  decide:0x002E<-getValue
 } 00000D62<-00000CE8  DEMO_Run:0x0022<-decide
 { 00000D62->00000CE8  DEMO_Run:0x0022->decide
There is a really annoying issue with using command line tools on Windows: the maximum length of the command line passed to cmd.exe is 8192 characters (see http://blogs.msdn.com/b/oldnewthing/archive/2003/12/10/56028.aspx). So you think this is not a problem for you, as you would not pass such a long command line to cmd.exe (the DOS shell under Windows)? Well, if you are using Eclipse (as I do) which generates make files (which is the normal way), then the cmd.exe very likely is involved to call the compiler/linker/etc, indirectly with the usage of make.exe. Compiling files is usually not a problem as it does not hit that 8192 limit. However, it is likely that link phase will end up with an error:

Error in the Problems View
If you have such a problem, there is a solution ….
For a home automation project I need to know the room temperature and humidity percentage of the room air. Adafruit has an inexpensive DHT11 sensor from http://www.aosong.com which I decided to use for that project.

Test Setup for DHT11 Sensor
Eclipse with GDB is great: it comes with a graphical front end for debugging. But sometimes it is all about to download a program. Is it really necessary to launch an IDE like Eclipse to program or quickly debug a board? With the GNU Debugger (GDB), the answer is ‘no’: GDB comes with a command line debugger which is designed exactly for this: providing a command line interface for programming/downloading and debugging, bypassing any GUI (Graphical User Interface).

Combination of GDB Debugging Probes and Boards (P&E, Segger and FRDM-KL25Z)
In case you are using Altium to design your boards, then this one might be useful for you:

FRDM-KL25_Footprint
OpenOCD is an open source and free-of-charge debugging solution, which is a great option here at the University of Lucerne, as students do not need to buy an expensive debugging probe. Still, I recommend to buy professional probes like the P&E or Segger ones, as they are worth every (Euro) cent. But for a ‘zero’ budget, OpenOCD with CMSIS-DAP is something to consider. And with Kinetis Design Studio using the GNU ARM Eclipse Plugins, OpenOCD is not that hard to be used. And because both Freescale and GNU ARM Eclipse offer OpenOCD Windows binaries, that connection method is in the reach of Windows users too.
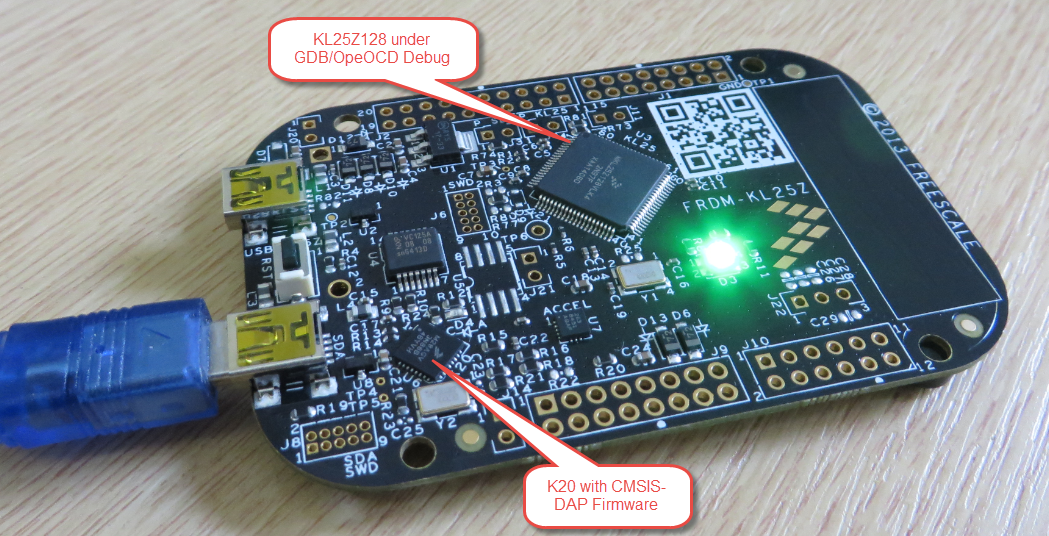
FRDM-KL25Z with OpenOCD Debug
