
P&E has upgraded their GDB implementation and interface used in combination with the GNU ARM Eclipse plugins: they support now advanced flash programming options plus the ability to attach/connect to a running target :-). This update is available as Eclipse update.
Advanced Options
P&E has extended their support in the GDB implementation for Multilinks and OpenSDA (e.g. FRDM boards). What I was missing was the ability to protect some areas of the flash (see “Preserving Memory Ranges with Eclipse and P&E GDB Server“) and the ability to attach/connect to a running application (see “Attaching to a Running Target with Segger J-Link, GDB and Eclipse“). The new Eclipse update (2.0.8.201504092111) has that now supported :-).
Installation
Use the menu Help > Install new Software:
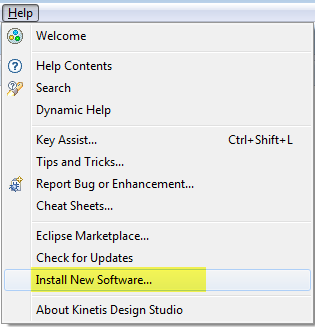
Install new software
Select the following update site:
http://www.pemicro.com/eclipse/updates
From there, select the update and go through the installation process:

GNU ARM PEMicro Interface Debugging Support
At the end, restart Eclipse.
New Debugger Tab Functions
Before the update, the debugger tab in the launch configuration looked like this:

Old Debugger Tab
After the upgrade, there are new items in the debugger tab of the launch configuration:

Debugger Tab
- Software registration: this simply removes this message/area after entering an email address, with an option to be informed about updates. It is a very simple process: enter an address, done. Data seems to be stored in the workspace metadata, so if I use a new workspace, I have to repeat the registration.
- Select Device: A new dialog allows to select/filter the device (instead of having a long scroll-down list):

P&E Select device
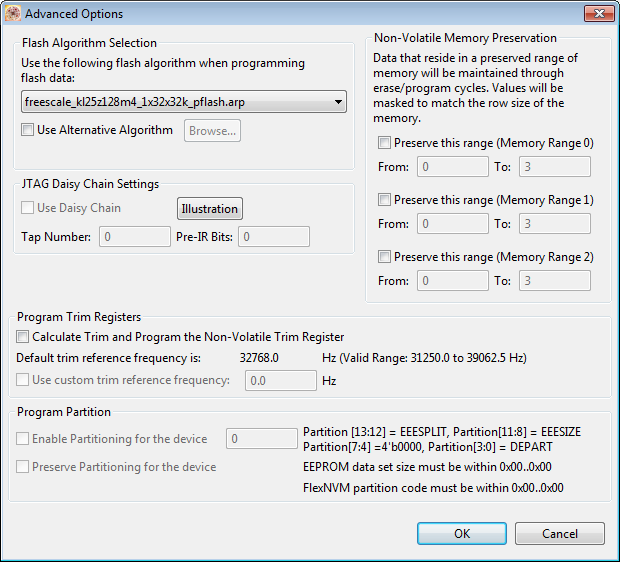
- Advanced Options: Now the GDB server includes functionality which was present in the CodeWarrior version: the ability topreserve FLASH ranges, programming the trimming and selecting the flash programming:

Advanced Options
- JTAG Daisy Chaining: if using JTAG debugging, then it supports now JTAG Daisy chaining. That way multiple microcontroller/cores can be debugged on the same chain (I have not tried that yet with the new plugin):
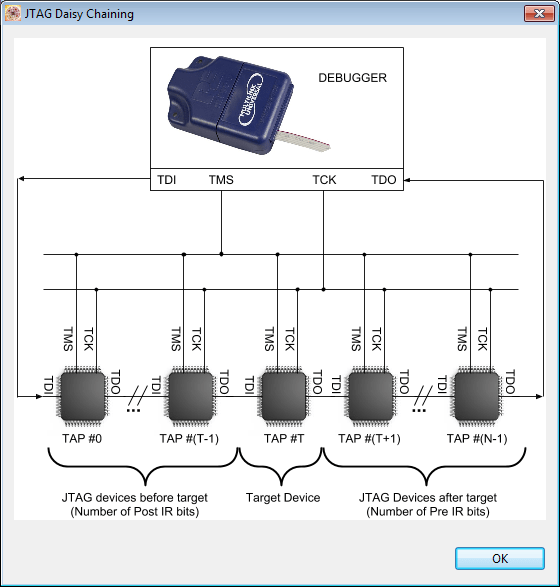
JTAG Daisy Chaining
- There are other options for program partitioning (for devices which support e.g. split between EEPROM/FLASH areas), or custom flash programming algorithms. I have not tried that out yet.


💡 As the name indicates: JTAG Daisy Chaining is only for JTAG, not SWD.
Startup Launch Configuration Tab
The ‘Startup’ tab has a new option added: ‘Attach to Running Target’:

Attach to Running Target
By enabling this, it is possible to connect/attach to a running target on the board. This is useful e.g. if it crashed or is stuck somewhere: attach do it and I can inspect what happened. Basically ‘attach’ connects to the target, without changing it.
Disconnect
In Eclipse debug view I can disconnect from a running target:

Disconnecting from Target
The P&E GDB server does what I expect it to do: it keeps the running program in the running state. This is cool as other debug probes might reset or halt the target: keep it running is the right way :-).
Attach/Connect
To attach to the running application, check that option in the launch configuration:

Attach to Running Target Option
Pressing now ‘debug’, it connects to the running target and keeps it running:

Connected to Running Target
To debug it, press the ‘pause’/suspend button, and it can be debugged as normally 🙂
Summary
The updated P&E GDB server plugin for Eclipse comes with nice extensions:
- Easier way to select the target microcontroller
- Advanced programming options: flash area preservation, JTAG scan chaining, trim configuration and program partitioning
- Connect/attach to a running target
I have used the new plugin successfully with my Kinetis Design Studio V2.0.0, so it is backwards compatible. To be able to attach to a running target is a big plus for me, plus now it is possible to preserve flash programming areas as it was in CodeWarrior. So upgrading should be a good thing :-).
Happy Debugging 🙂

Hi
I can’t see any USB port in the “Port:” drop down menu.
Thanks!
LikeLike
Hi Manuel,
this means that the P&E device is not recognized. Here are a few things to check:
I hope this helps,
Erich
LikeLike