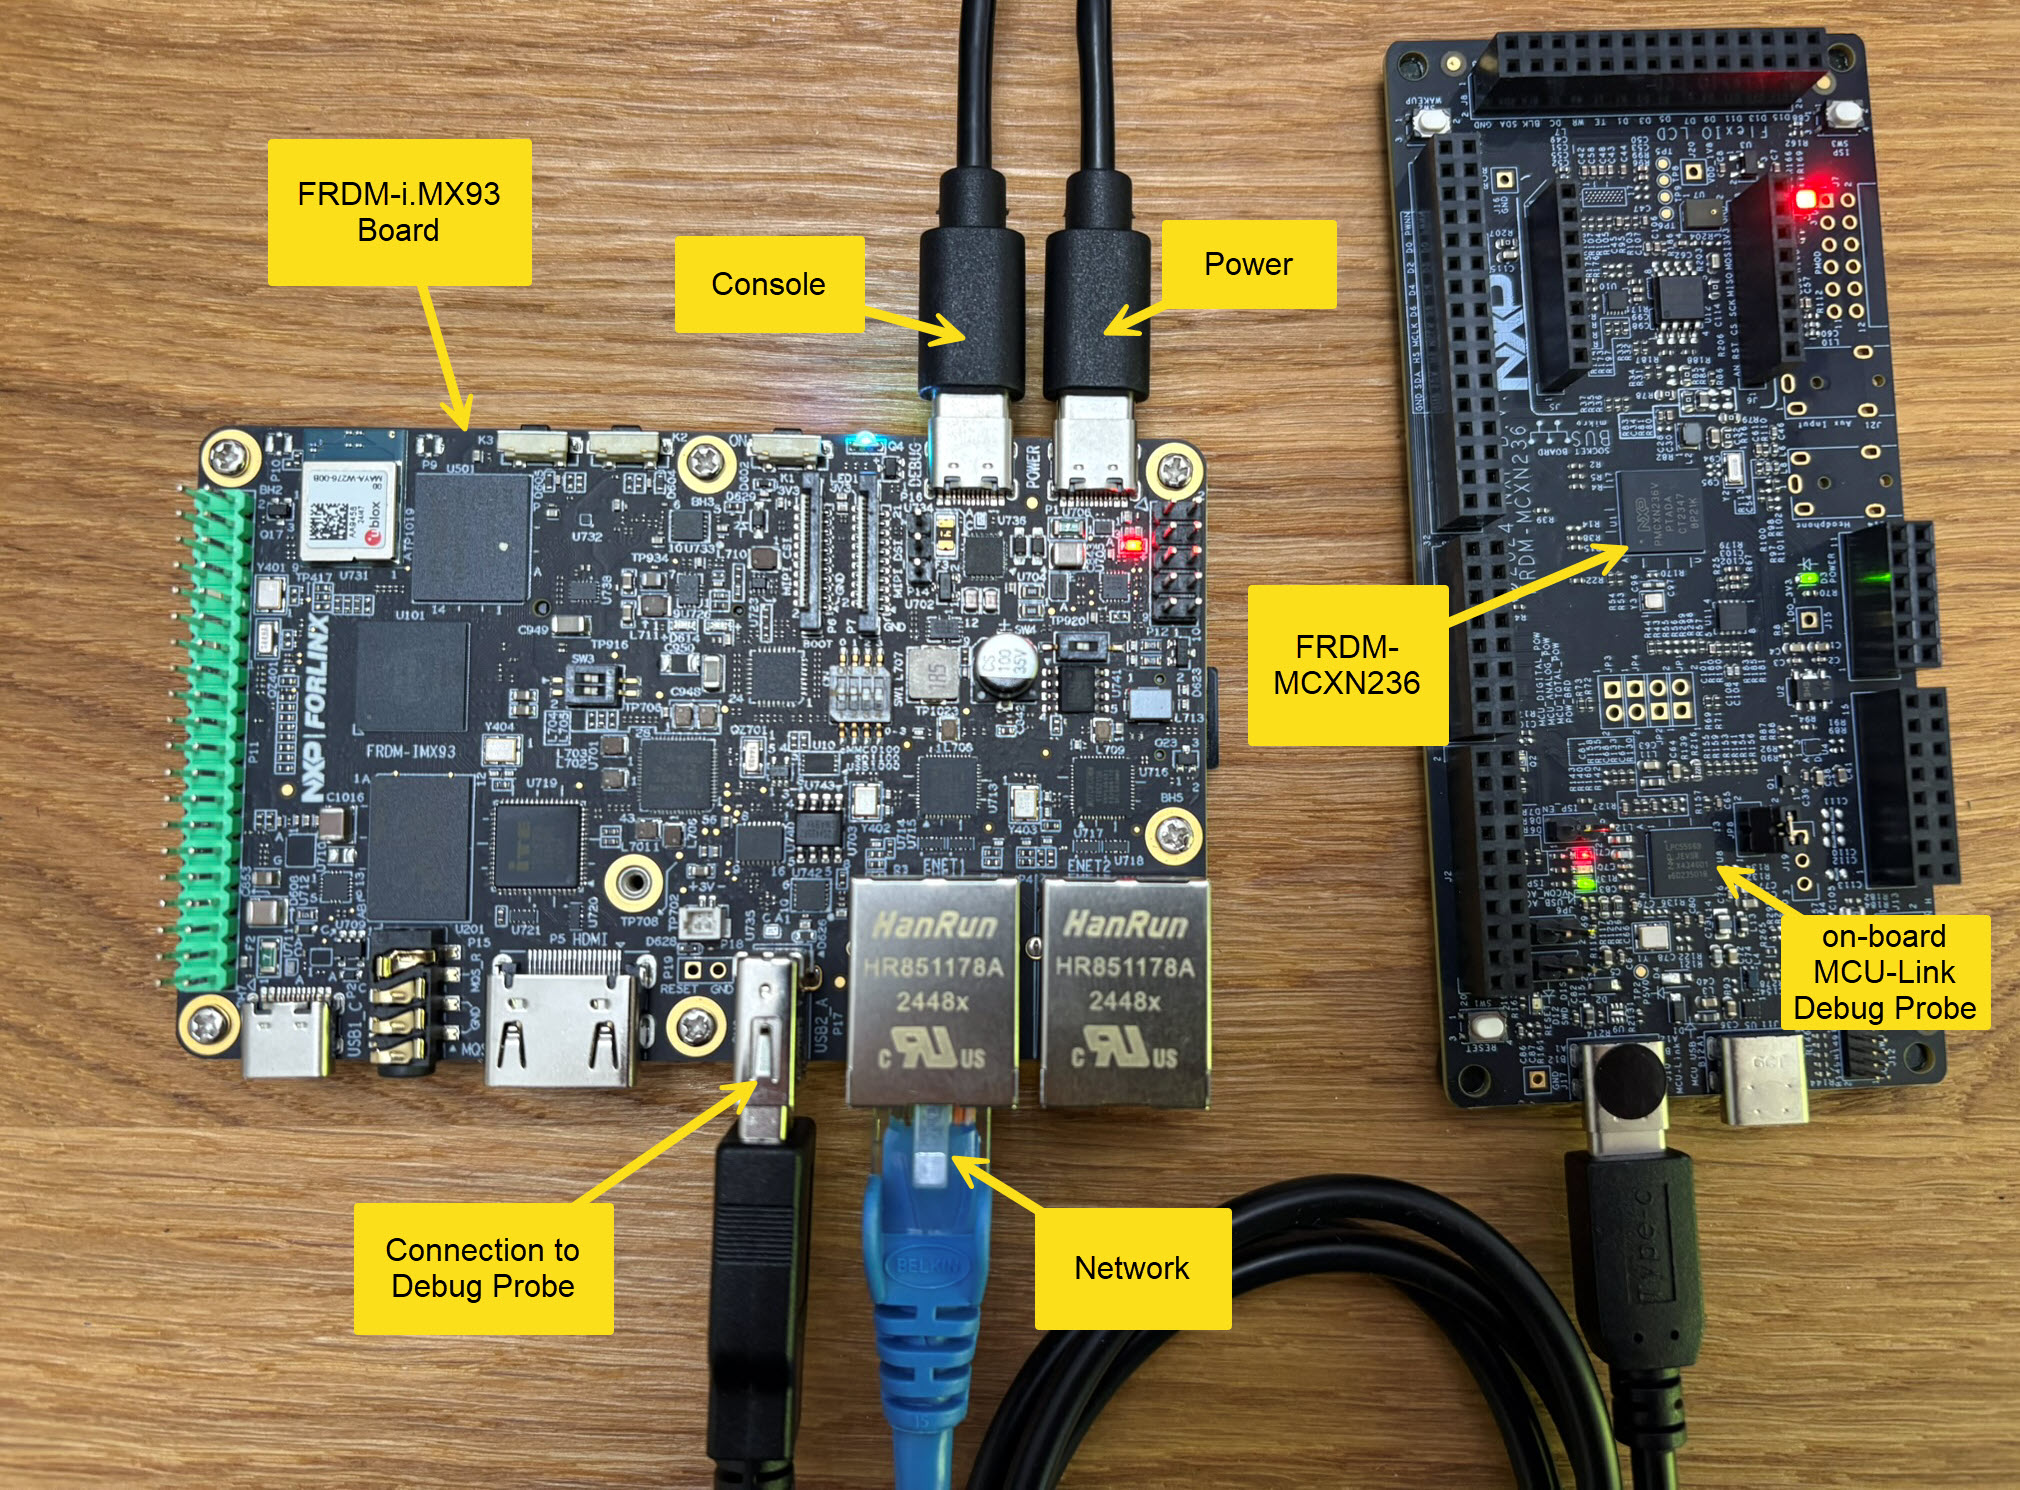
Remote debugging an embedded target is very useful: I don’t need a direct debug probe or USB cable connection. Instead, I’m using a network connection (wired or even wireless) over TCP/IP to talk to the debug probe and target. That way I can place the debug probe and target system away from my desk.
In Remote Debugging with USB based JTAG/SWD Debug Probes I showed how normal USB based debug probes can be used. This approach uses a remote host machine (e.g. desktop machine or notebook). This approach is still expensive, not scalable and the host machine needs a lot of space too.
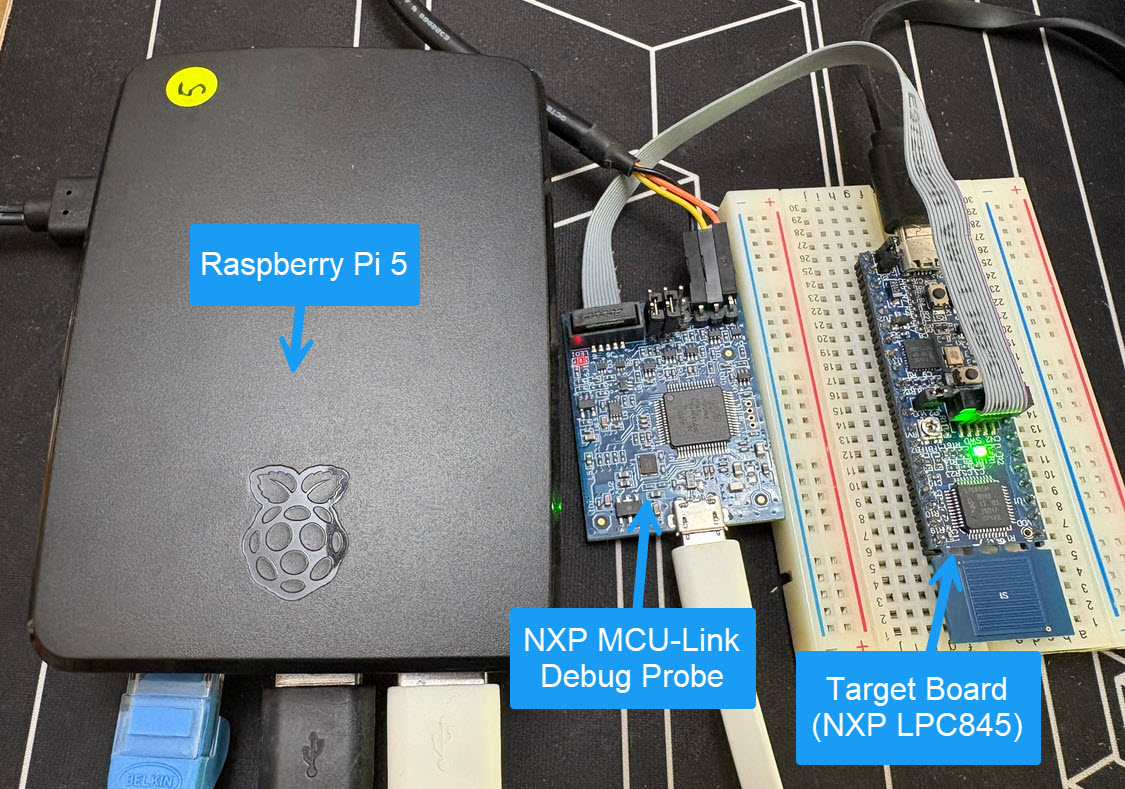
So what if I use a Raspberry Pi instead? The RPi is small, inexpensive and ideal for such a task. Additionally, I can easily use it to build a test or debug farm. In this article, I show the use of the Raspberry Pi for remote debugging. A sub $20 or embedded target debug probe can be employed.
Raspberry Pi with NXP MCU-Link for Embedded Target DebuggingContinue reading →
Embedded hardware comes with limitations, and one if it is the given number of hardware breakpoints. Depending on your MCU, 4 or only 2 hardware breakpoints are available, making debugging and stepping in read-only memory (FLASH) a challenge.
Debugging NXP LPC845 with unlimited FLASH Breakpoints using MCU-Link
Did you know that one can have ‘unlimited’ number of breakpoints in FLASH, with the help of GDB? This is very useful for extended debugging, or if you want to use breakpoints for testing?
A typical debugging session involves just one ELF/Dwarf binary or executable. But what if I need to program multiple binary files with gdb? Things like loading both the bootloader and the application binary? Or I have a an on-chip file system or data section I need to program?
In this article I show how I can use gdb to load and program extra data, like a binary (.bin) file, both using command line interface and using an IDE.
I’m not a big fan of using printf() in embedded applications, but I have to admit that in some cases it is very useful. One problem in debugging embedded systems debugging is getting values or information off the target: because of the limited resources this can be very challenging.
So why not doing this with the debugger in an automated way? And here dynamic printf breakpoints can help: it adds printf()-style output on-the-fly to your program without the need to recompile or restart your program, without the need to run printf() on the target:
Sometime I’m pretty sure I wrote about a topic I can find or refer to, and I was pretty sure I did write about ‘attaching to a running target’ using MCUXpresso IDE in an article, but Google does not find it? The only rational outcome is that I can blame Google and I have to come up with a potential duplicate ;-).
Anyway: attaching to a running target is such an essential life saver it deserves a dedicated article.
Using the debugger to inspect the application data is a very convenient thing. But if the data grows and if the data set is large, it makes more sense to dump the data to the host and process it offline. GDB is the de-facto debugger engine and includes a powerful command line and scripting engine which can be used in Eclipse too.
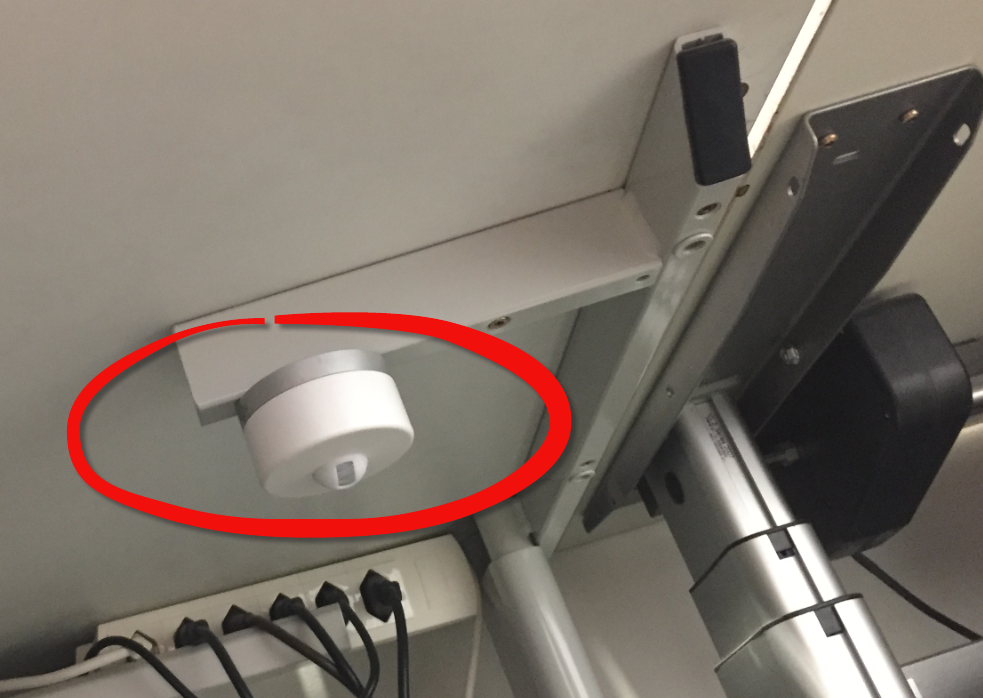
New ‘things’ start to pop up, useful or not: From smart bulbs (Philips Hue), thermostats (Nest), smart TV (Samsung and others) up to voice assistants (Alexa, Cortana, Google). You might even have installed one of these, right? What about temperature and humidity sensors? Probably there is nothing wrong with that?
But what would you think if one morning you find a strange unknown device installed under your working desk, connected to the cloud and internet?
GDB supports a mode which allows the GDB debug client to read memory while the target is running. This allows features like ‘live variables’: that way I can see the variables refreshed and changing over time without halting the target. Another functionality which comes with that feature is to check stopped threads or to see all threads in the system.